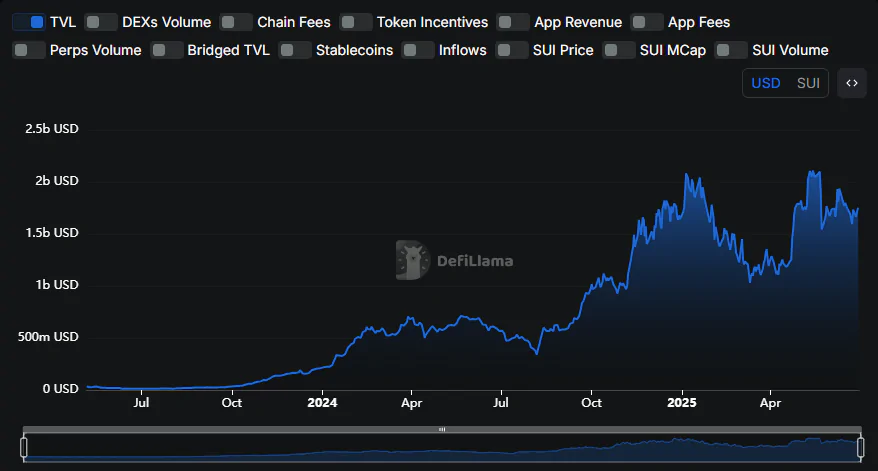
SUI has re-entered the spotlight, and for good reason. As market dynamics evolve and capital begins rotating into efficient Layer-1 ecosystems, SUI is once again under investor scrutiny. Its Total Value Locked (TVL) has shown a steady climb over the past few months, reflecting growing traction across on-chain protocols, an encouraging signal in a cautious market.
Whatever the reason might be; you’re managing a position from earlier cycles or assessing fresh upside at current levels, understanding where SUI truly stands is essential. This SUI Price Prediction report offers a data-driven outlook, grounded in fundamentals, price structure, and on-chain performance, to help frame realistic expectations for 2026 and beyond.
SUI’s Historical Pattern: Volatility, Consolidation, and Continued Development
SUI’s early days were filled with excitement. When it reached $5, it felt like the next big thing. Traders were confident, communities were buzzing, and speculation was running hot. Then came the comedown: a sharp correction, followed by a slow drift and rising doubts about whether SUI Network was just another short-lived Layer-1 project.
But what followed was unusual for crypto. The team didn’t vanish, the development didn’t stall, and the ecosystem didn’t collapse. The price volatility remained, but Sui kept moving forward. In a space where many projects disappear after the spotlight fades, consistency matters.
Loading...
Rank #Symbol
-
ATH
-
Current Price
-
Market Cap
-
Total Supply
-
Support 1
(Fib 0.618)
-
Support 2
(Fib 0.5)
-
Resistance 1
(Fib 1.382)
-
Resistance 2
(Fib 1.618)
-
Technical Analysis: SUI’s Mid-2025 Crossroads
As we move into the second half of 2025, SUI finds itself in a tough but not unfamiliar spot. The initial hype has cooled, and what remains is a market watching for direction. At the moment, price action is stuck in a range, with traders showing hesitation rather than conviction. This isn’t about panic; it’s more of a pause.

The Relative Strength Index (RSI) is hovering around 42, which typically suggests weak momentum but not extreme oversold pressure. That usually leads to indecision, where buyers are cautious and sellers aren’t pressing too hard. At the same time, recent price closes below the 50-day and 200-day moving averages are setting a tone of hesitation across trading desks. There’s no strong bullish or bearish control yet.
A key level to monitor is the $2.65 to $2.75 zone. That area has shown signs of quiet accumulation. If SUI can stabilize there and reclaim $3.00 with decent volume, it could test higher resistance near $3.29 to $3.50. Until then, any upside may be short-lived unless accompanied by a major catalyst.
Looking at the live indicators below, the technical sentiment aligns with what the chart is already hinting at. The Summary gauge is pointing toward a “Sell” zone, with 13 signals currently bearish, only 4 suggesting a buy, and 8 sitting on the fence. That’s not a panic signal, but it does tell us the market isn’t leaning bullish right now.
The Oscillators are holding near neutral, which is common in range-bound environments. Nothing is strongly pushing either way, and that often means traders are waiting on external cues like news, volume spikes, or broader market shifts.
Meanwhile, the Moving Averages are showing a strong sell. This is largely due to the price staying below all major EMAs and the recent crossover between the 50-day and 200-day lines, commonly known as a “death cross”. Historically, that setup doesn’t promise a crash, but it does suggest headwinds for short-term rallies.
SUI Live Technical Summary
Ecosystem Activity: What the Data Actually Shows
Forget the hype, the real story unfolds in on-chain data, and the latest numbers from DefiLlama and Dune make it clear that Sui’s ecosystem isn’t just alive, it’s evolving.
As of mid-2025, Sui’s Total Value Locked (TVL) has reached approximately $1.85 billion. This isn’t just a rebound story. It puts Sui ahead of many newer Layer-1 chains, and even some that launched before it. Protocols like Navi and Scallop are now handling hundreds of millions in value, while Bluefin’s daily trading volume alone crosses $200 million regularly.

Source: DefiLlama Sui Stats
But TVL is just the surface. Looking deeper, dashboards from Dune show that new wallets are actively trading, not just whales recycling funds. The number of fresh wallets making first-time trades has risen in recent weeks, and median wallet holding time has stretched longer, hinting at real accumulation rather than quick flipping.
Another underrated stat is Sui’s on-chain fee revenue. In late 2024, it beat Aptos by more than 20% in total fees collected. That’s not just a flex; it means validators and stakers are seeing better returns, which makes the whole chain more attractive for long-term infrastructure players.
Add to that the uptick in protocol-level activity tracked on dashboards like Paulax’s Dune breakdown, and you start to see that Sui’s not just surviving, it’s low-key building a functional, high-volume, multi-app economy.
Read more: How to Buy SUI Tokens
What’s Really Moving SUI?
SUI’s market behavior isn’t just about charts or indicators; it’s tied closely to fundamentals, external factors, and investor sentiment.
The ongoing token unlocks remain a significant pressure point. Each release adds new supply to a market that hasn’t fully absorbed it. At the same time, while Sui’s total value locked (TVL) is gradually increasing, the pace isn’t explosive. Much of its growth hinges on the success of native applications and user traction.
Macro conditions also continue to influence SUI’s price. Bitcoin’s direction, regulatory tone, and overall market confidence often affect altcoins more than their own developments.
One positive sign is developer activity. Contributions to Sui’s GitHub remain steady, indicating a committed team. However, that activity needs to translate into actual user adoption and practical use cases, otherwise, it doesn’t mean much to the market.
Future Outlook and Price Predictions
As the market matures and more real-world use cases unfold, long-term interest in SUI is starting to shift from speculation to sustainability. While short-term moves are tied to volatility, long-term price action will likely depend on adoption, integrations, and macro sentiment. Below is a simplified forecast model that offers a baseline, not a promise, of where SUI could head, depending on market behavior and development cycles.
| Year | Minimum | Average | Maximum |
|---|---|---|---|
| 2026 | $2.10 | $3.85 | $5.90 |
| 2027 | $3.10 | $4.90 | $8.75 |
| 2028 | $4.25 | $6.50 | $10.20 |
| 2029 | $5.00 | $7.80 | $12.50 |
| 2030 | $4.80 | $7.10 | $13.00 |
Bottom Line
Sui’s journey has been far from linear. There’s been early hype, rapid corrections, cautious optimism, and everything in between. But the project has stayed on track, quietly building through it all. This Sui Price Prediction doesn’t try to oversimplify the outcome. Short-term, the bias remains slightly bearish unless something new shifts market perception.
Long-term potential still exists, but only if the project moves beyond its initial momentum and proves it can deliver tools, products, and value that matter to users beyond its early community. Until then, it’s a project worth watching, not for its buzz, but for how well it can translate potential into presence.
FAQs
1. What is Sui (SUI) and how does it actually work?
Sui is a next-generation Layer-1 blockchain built for scalability, speed, and ease of development. It uses an object-centric data model and the Move programming language, allowing for parallel transaction processing and faster finality.
2. What makes Sui different from other blockchains?
Unlike traditional account-based blockchains, Sui treats assets as independent objects. This enables parallel execution of unrelated transactions, a key advantage for applications like DeFi and Web3 gaming.
3. What’s the outlook for SUI in mid-2025?
SUI appears to be consolidating between $2.50 and $4.00. A breakout will likely depend on a strong trigger, be it a product launch, new integration, or improved market conditions.
4. How do traders approach SUI?
Traders monitor key indicators like RSI and EMAs, but they’re also keeping a close eye on ecosystem progress and liquidity. In this market, momentum and real-world traction often matter just as much as technical setup.
5. Is SUI a good long-term investment or just short-term hype?
SUI has moved past its initial hype phase and is now being judged on fundamentals like developer activity, ecosystem growth, and protocol adoption. While short-term price swings remain, long-term potential depends on whether the network can sustain traction, attract users, and deliver real-world use cases.


![How to Change the Language in Phantom [2026]](https://www.cryptowinrate.com/wp-content/uploads/2026/02/How-to-Change-the-Language-in-Phantom-2026-1024x576.jpg)
