


Whether you’re a novice trader or an experienced investor, mastering chart patterns can significantly enhance your ability to analyze and interpret market movements.
This is a comprehensive guide designed to equip traders with essential knowledge for understanding trading markets.
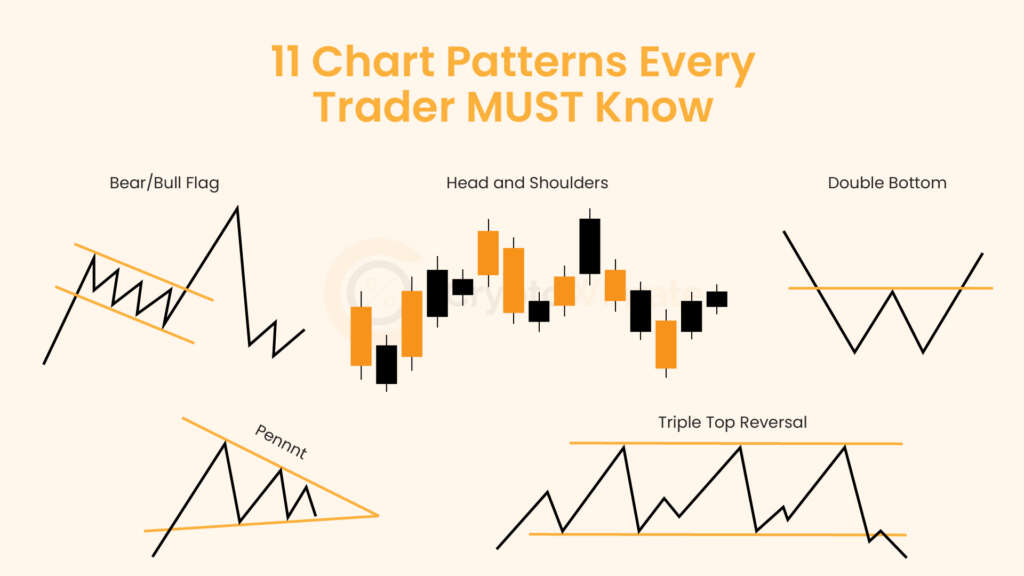
In this blog, we look into 11 crucial chart patterns that every trader should be familiar with. From classic patterns like head and shoulders to more complex formations such as triangles and wedges, understanding these patterns is crucial for identifying potential trend reversals, breakouts, and continuation signals.
Let’s start exploring.
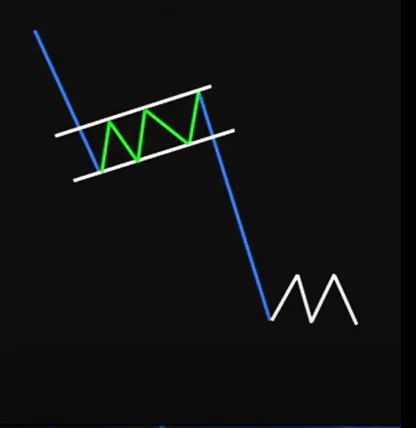
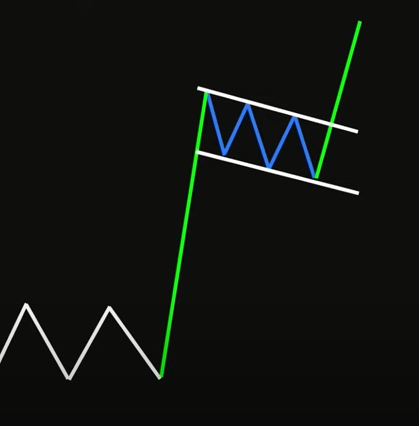
1: Bear/Bull Flag
The bear flag pattern is a technical analysis pattern used by traders to identify potential downward trends in financial markets, particularly in stocks and forex.This pattern typically forms after a significant downward price movement, followed by a brief period of consolidation, creating a flag-like shape with a downward-sloping trendline (the flagpole) and a parallel trendline (the flag).
Traders interpret this pattern as a sign of continued bearish sentiment, anticipating further price declines. Once the price breaks below the lower trendline of the flag, it often triggers selling pressure, leading to a resumption of the downward trend.
The bull flag pattern is a popular technical analysis tool used by traders to identify potential upward price movements in financial markets, particularly in stocks, forex, and cryptocurrencies. It typically forms after a strong upward price movement, known as the flagpole, followed by a period of consolidation, forming a rectangular-shaped flag.
This consolidation phase represents a temporary pause or pullback in the uptrend, often accompanied by lower trading volumes. Once the price breaks out above the upper boundary of the flag with significant volume, traders anticipate a continuation of the previous uptrend, potentially leading to further price appreciation.
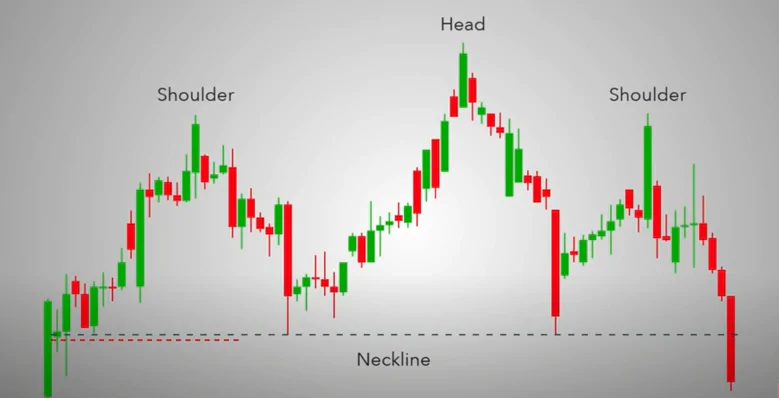
2: Head and Shoulders
The head and shoulders pattern is a widely recognized chart pattern in technical analysis, typically signaling a potential trend reversal. It consists of three peaks: a central peak (the head) flanked by two lower peaks (the shoulders). The pattern is formed when an asset’s price reaches a high point, retraces, rallies again to a higher peak, retraces once more, and then fails to reach the previous high, forming the second shoulder.
This pattern suggests that bullish momentum is weakening, indicating a possible shift to bearish sentiment. Traders often look for confirmation signals such as volume divergence or breakouts below the neckline, a support level formed by connecting the lows of the two troughs between the shoulders and the head.
3: Cup and Handle
The cup and handle pattern is a technical analysis tool used in financial markets to identify potential bullish continuation patterns in a stock’s price chart. It consists of two main components: the cup, which resembles a rounded bottom, and the handle, which is a smaller consolidation period following the cup formation.
This pattern suggests a temporary pause or consolidation in price after a significant uptrend, followed by a potential continuation of the upward momentum. Traders often look for this pattern as it may indicate a buying opportunity, anticipating a breakout above the handle’s resistance level. 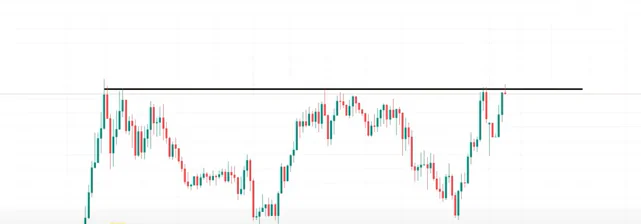
4: Double Bottom
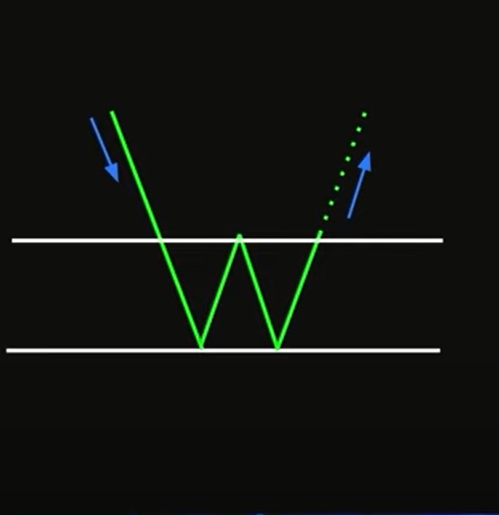
The double bottom pattern is a significant technical analysis tool utilized in financial markets. It typically appears on price charts and signifies a potential reversal of a downtrend. Visually, it resembles the letter “W”, indicating two consecutive troughs at roughly the same price level, separated by a peak. This pattern suggests that selling pressure has exhausted itself, and buyers are gaining strength.
Once the price breaks above the peak separating the two troughs, it confirms the pattern and often triggers a bullish trend. Traders often look for other confirming signals, such as increasing trading volume, to strengthen their confidence in the pattern’s validity before making trading decisions.
5: Double Top
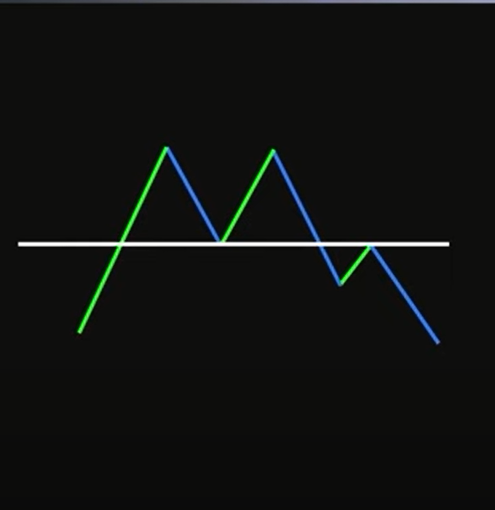
The double-top pattern typically forms after an asset reaches a peak price, retreats, and then comes back again to a similar high before experiencing a downturn. Traders recognize this pattern as two consecutive peaks, often resembling the letter “M” on a price chart. The pattern suggests that buyers are failing to push the price higher, indicating a shift in market sentiment from bullish to bearish.
Traders often look for confirmation signals such as a break below the pattern’s neckline to validate the reversal. Double-top patterns are commonly used by traders to anticipate potential selling opportunities or to manage existing long positions.
6: Wedges
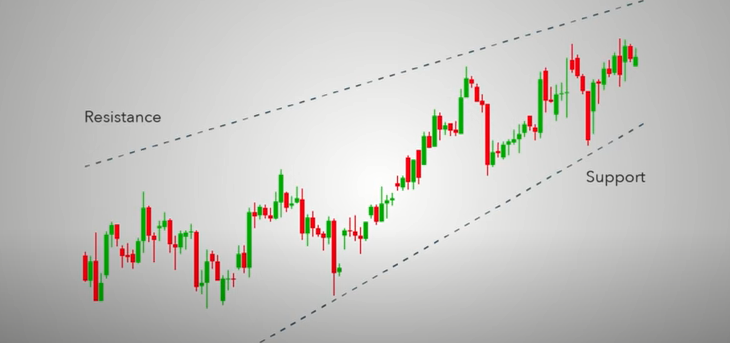
The wedge pattern is a technical analysis tool used by traders to anticipate potential market reversals. Characterized by converging trend lines sloping either upwards or downwards, the wedge pattern indicates a period of consolidation before a significant breakout.
Traders often identify two types of wedge patterns: rising wedges, where both the support and resistance lines slope upwards, suggesting a potential bearish reversal, and falling wedges, where both lines slope downwards, indicating a possible bullish reversal.
As the price oscillates within the narrowing range of the wedge, traders closely monitor volume and momentum indicators for clues about the impending breakout direction. Successful interpretation of wedge patterns can offer lucrative trading opportunities by capitalizing on trend reversals.
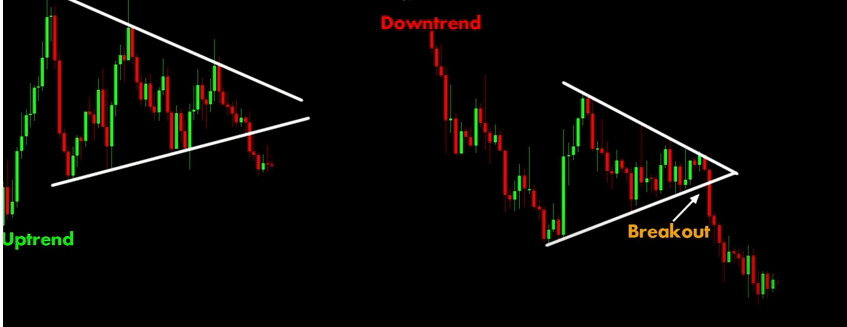
7: Symmetrical Triangle
The symmetrical triangle pattern is a versatile technical analysis tool utilized by traders to identify potential trend continuations or reversals. In an uptrend, the symmetrical triangle typically forms a consolidation pattern, indicating a temporary pause before the continuation of the upward momentum. Traders often look for a breakout above the upper trendline as a signal to enter long positions, anticipating a further upward movement. Conversely, in a downtrend, the symmetrical triangle can signal a brief respite in the downward movement before the trend resumes. Traders watch for a breakout below the lower trendline to initiate short positions, expecting the downtrend to persist.
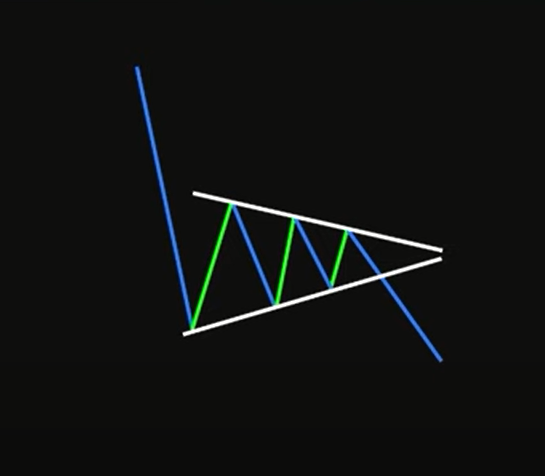
8: Pennnt
These patterns typically occur after a strong price movement, where the price temporarily consolidates within converging trend lines, these patterns resemble a small symmetrical triangle, formed by converging trend lines. Typically, pennants occur after a sharp price movement, indicating a temporary pause or consolidation before the trend resumes.
Bulls and bears battle within the pennant’s confines until a breakout occurs, signaling the continuation of the previous trend. Traders often look for increasing volume as the breakout approaches, validating the pattern’s significance. While pennants offer insights into market sentiment and potential price movements, false breakouts can occur, so risk management and cautious entry strategies are essential when trading this pattern.
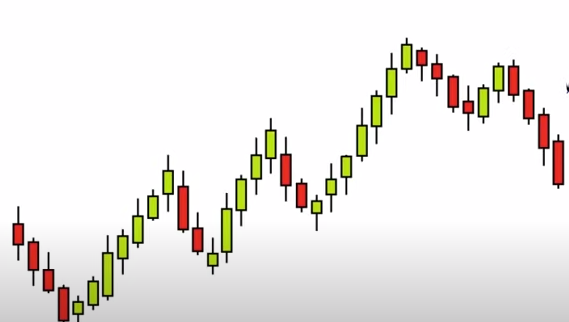
9: Bump n Run Reversal
This pattern typically consists of three phases: a lead-in phase, a bump phase, and a run phase. During the lead-in phase, prices gradually trend upward, indicating bullish sentiment. The bump phase is characterized by a rapid increase in prices, often accompanied by high trading volume, creating a pronounced peak. This peak forms the “bump” of the pattern.
Following the bump phase, there’s a correction in prices, known as the run phase. This correction usually retraces a significant portion of the gains made during the bump phase.
Traders often look for specific criteria, such as volume patterns and the angle of the trendline, to confirm the validity of the bump and run reversal pattern before making trading decisions. By recognizing this pattern early, traders can potentially capitalize on impending trend reversals and adjust their strategies accordingly.
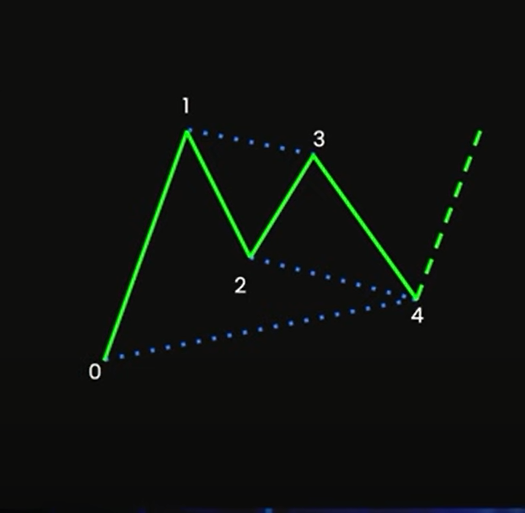
10: Gartley
The Gartley pattern is a powerful tool, revered by traders for its predictive capabilities in the financial markets. Named after its creator, H.M. Gartley, this pattern identifies potential reversal points in price action. It consists of a series of precise Fibonacci retracements and extensions, forming a shape resembling a harmonic butterfly.
Traders look for specific ratios within the pattern, such as the 61.8% retracement of the initial move, to confirm its validity. Once identified, traders can execute trades with defined entry, stop-loss, and take-profit levels. The Gartley pattern is renowned for its accuracy and is often used in conjunction with other technical indicators to enhance its effectiveness in forecasting market movements.
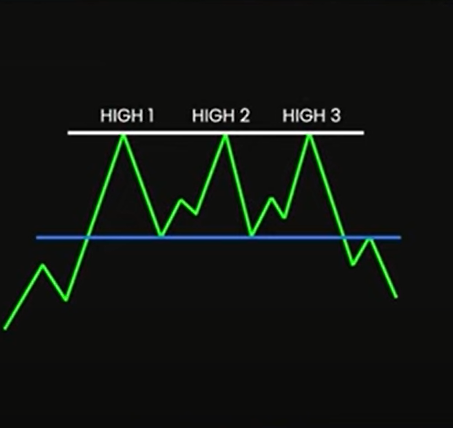
11: Triple Top Reversal
The triple-top universal pattern is a significant technical analysis formation in crypto trading. It typically occurs when the price of an asset reaches a peak three times, failing to break through a resistance level, forming three consecutive peaks at approximately the same price level. This pattern signals a potential trend reversal from bullish to bearish, indicating that buyers are becoming exhausted, and sellers may take control.
Traders often watch for confirmation signals such as a break below the neckline, which is the support level connecting the lows between the peaks. Triple-top patterns are considered reliable indicators when accompanied by high trading volume, providing traders with an opportunity to anticipate and capitalize on a potential downward trend.
What is a Chart Pattern?
A chart pattern in cryptocurrency trading refers to formations on price charts that signal future price movements. These patterns emerge from the historical price data of an asset and are categorized into bullish, bearish, or continuation patterns. Common chart patterns include head and shoulders, triangles, flags, and double tops or bottoms.
Traders analyze these patterns to predict market direction and make informed trading decisions. Understanding chart patterns involves recognizing key price levels, trend lines, and patterns’ symmetry. However, it’s necessary to complete pattern analysis with other technical indicators and fundamental analysis for extensive market evaluation and risk management.
How to Trade With Patterns?
Trading with patterns involves recognizing repetitive formations on price charts that indicate potential future price movements. However, relying solely on patterns can be risky. It’s crucial to integrate other indicators for confirmation. When a pattern emerges, wait for a breakout confirmation to ensure validity. Implementing stop-loss orders safeguards against significant losses if the trade moves against expectations.
Equally important is setting up a take-profit target to secure profits. Successful pattern trading demands patience, discipline, and a thorough understanding of the market. By combining patterns with confluence indicators and risk management strategies, traders increase their likelihood of making informed and profitable decisions.
Do You Need Chart Patterns for Trading?
Chart patterns are not a necessity for crypto trading, but they can be incredibly helpful for traders looking to identify potential price movements. While some traders rely solely on fundamental analysis or indicators, chart patterns offer visual cues that can aid in decision-making.
Patterns like head and shoulders, triangles, flags, and double tops/bottoms can indicate potential trend reversals or continuations. Understanding these patterns allows traders to anticipate market movements and make informed trading decisions. Still, it’s crucial to blend chart patterns with other analysis techniques for a comprehensive trading strategy.
In a Nutshell
Understanding chart patterns is essential for traders to understand the complexities of trading markets effectively. In this blog, we’ve explored 11 key patterns, from the classic head and shoulders to the bullish pattern. By mastering these patterns, traders gain valuable insights into market details, enabling them to make informed decisions and capitalize on profitable opportunities with confidence and precision.
FAQs
1 – Do Chart patterns predict the future?
Chart patterns in crypto trading can provide insights into potential future price movements based on historical price data and market psychology. While they’re not guarantees, patterns like triangles, head and shoulders, and double tops can indicate potential trends or reversals. Traders often use them in conjunction with other indicators and analysis techniques to make informed decisions, but they should be used cautiously as market conditions can change rapidly.
2 – Do chart patterns always work?
Chart patterns in crypto trading, like in any market, aren’t foolproof. While they offer insights into potential price movements based on historical data, they’re not guaranteed indicators. Market conditions, news events, and other factors can invalidate patterns. Traders use them as part of a broader analysis, combining them with other tools for better decision-making, and understanding their limitations.
3 – How many chart patterns are there?
There are numerous chart patterns in crypto trading, ranging from simple ones like pennets and wedges to formations like head and shoulders, double tops, and flags. These patterns are used by traders to analyze price movements and make informed decisions about buying or selling assets. Each pattern signifies potential trends in the market.
4 – Which chart pattern is the best?
Determining the “best” chart pattern depends on various factors, including market conditions, timeframe, and personal trading style. Some traders favor patterns like triangles for trend continuation, while others prefer double tops/bottoms for reversals. Ultimately, it’s essential to understand multiple patterns and use them strategically based on the specific context of each trade.