


What is the Head and Shoulders Pattern?
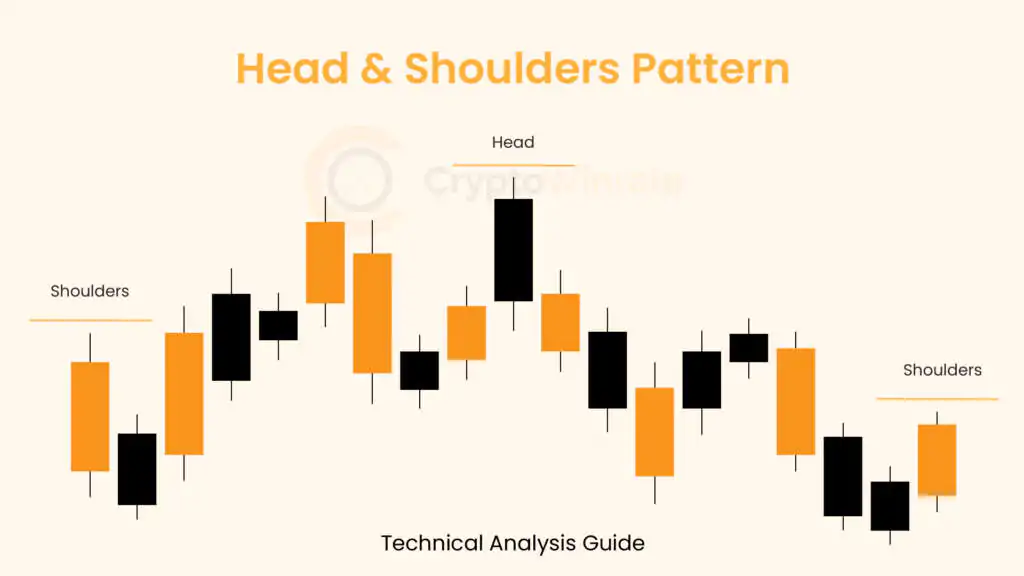
In technical analysis, the head and shoulders pattern stands out as a significant chart formation, indicating a potential shift from a bullish to a bearish trend. This pattern presents itself as a specific price action framework featuring three distinct peaks, with the outer two being relatively close in height and the middle peak standing tallest.
Head and Shoulders Formation
Initially, the asset’s price in an uptrend ascends to a peak, subsequently retracing back to a level of not more than 50% of the prior upward movement and establishing the neck line.
Following the initial price pull-back, the price ascends once more, surpassing the previous peak to form what is known as the “head,” only to decline back to the original neck line (the support level after price correction from the first peak). Finally, the security price experiences a third peak, typically around the price level of the first peak in the formation, before descending once again.
Trend Reversal
The trend is your friend, until the bend at the end is a popular saying among practitioners of trend following strategies, and many believe that the head and shoulder pattern is that bend at the end. It is considered among the most dependable indicators of an impending trend reversal patterns, signaling the conclusion of an upward trend. This formation holds a prominent place, albeit with varying degrees of accuracy.
Key Takeaways
- The head and shoulders pattern is a significant chart formation in technical analysis indicating a potential shift from a bullish to a bearish trend.
- It features three distinct peaks, with the middle peak being the highest and the outer two relatively close.
- This pattern starts as the asset’s price (stock, Cryptocurrency, or Forex) climbs to a peak, does a pull-back not greater than 50% of the initial trend to establish a neckline, forms a subsequent higher peak (referred to as the “head”), and then retreats to the neckline before forming another peak.
- An inverted head and shoulders pattern forecasts a shift from a bearish to a bullish trend.
- The neckline is established either at support or resistance lines, according to the direction of the trend.
- Renowned for its reliability, the head and shoulders pattern is considered one of the most dependable indicators of an impending trend reversal, though its accuracy may vary.
How to identify the Head and Shoulders Pattern
- Following a prolonged bullish trend, the price reaches a peak and then retreats to establish a trough.
- Subsequently, the price rebounds to create a second peak significantly higher than the initial one, followed by another decline.
- The price undergoes a third rise, but only to the level of the first peak, before declining once more.
- The neckline, drawn at the two troughs or peaks (inverse), serves as a critical reference point.
In this pattern, the first and third peaks represent the shoulders, while the second peak forms the head. Furthermore the support line connecting the first and second troughs in the structure is referred to as the neckline.
Head and Shoulders vs Inverse Head and Shoulders
Head and Shoulders
A head and shoulders chart pattern that begins from a downtrend is known as the inverse head and shoulders, or alternatively, a head and shoulders bottom. In contrast to its counterpart, this pattern is inverted, and it is utilized to predict reversals in downtrends.
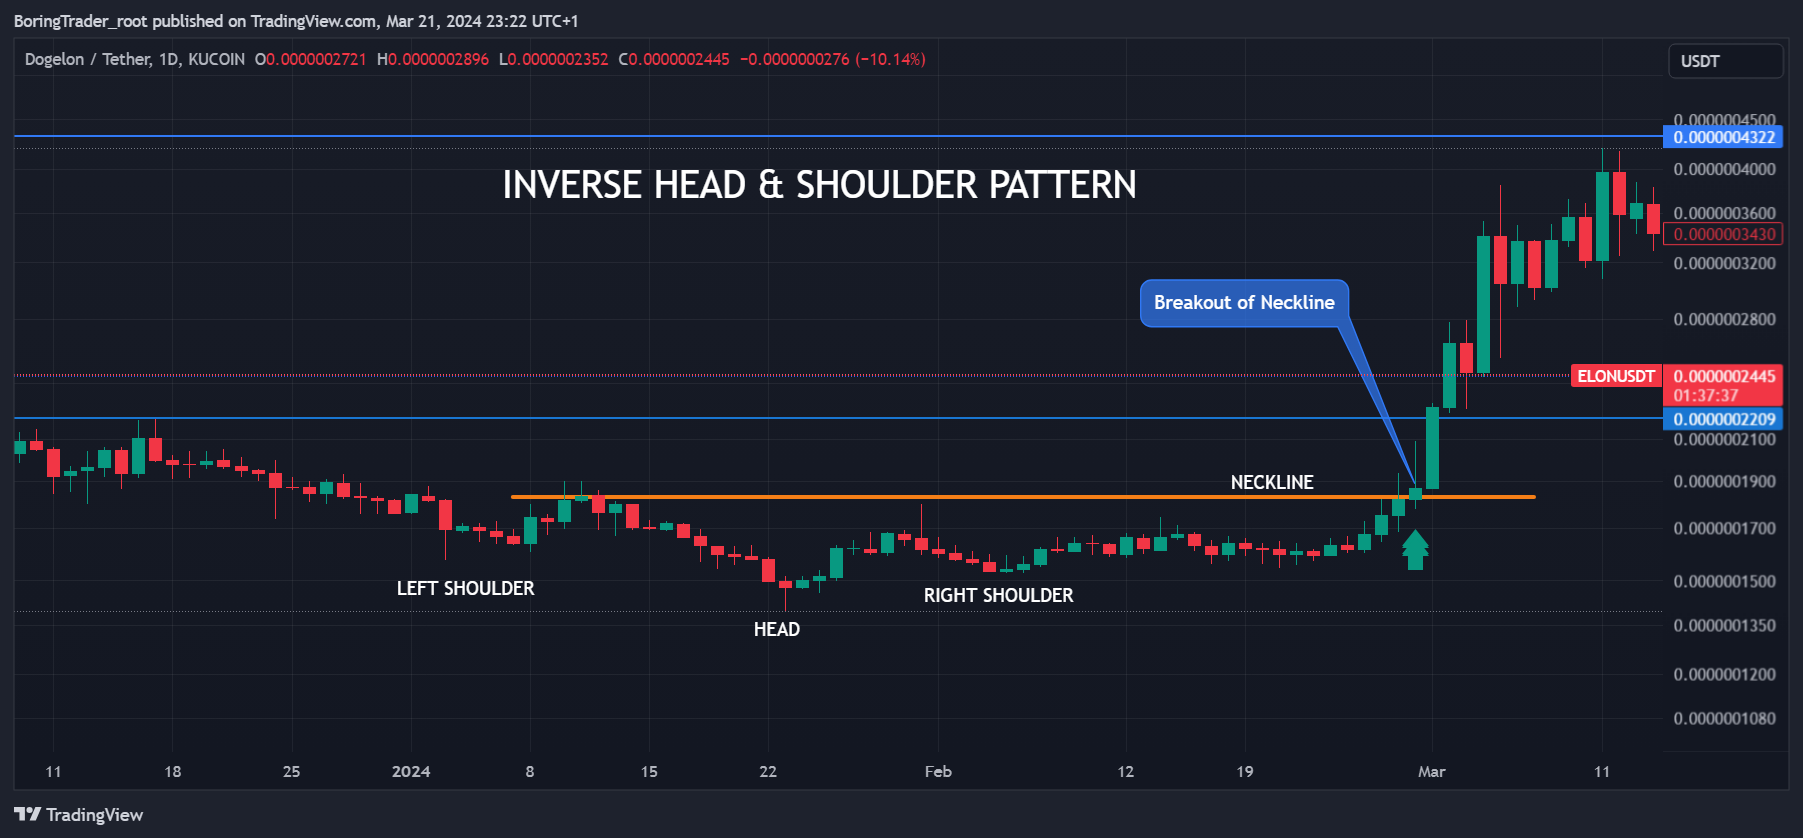
Inverse Head and Shoulders Pattern
The following characteristics in the price action of a security will guide in identifying this pattern:
- Initially, the price descends to a trough, followed by a subsequent rise.
- Then, the price drops below the previous trough but rebounds once more.
- Subsequently, the price declines again, though not as extensively as during the second trough. At this point, the third trough must not drop lower than the second trough, qualifying it as a valid inverse head and shoulders pattern.
- Finally, after establishing the final trough, the price starts to ascend towards the resistance level, also known as the neckline, established at a price zone near the top of the previous troughs.
Similar to the head and shoulders pattern, the inverse head and shoulders pattern serves as a dependable indicator, signaling an impending reversal from a downward trend to an upward one. In this scenario, the stock’s price undergoes three consecutive lows, spaced by temporary price gains.
Among these, the second trough represents the lowest point (the head), while the first and third troughs are marginally less profound (the shoulders). The subsequent rally following the third dip indicates the reversal of the bearish trend, suggesting that prices are poised to continue their upward trajectory.
How to trade the Head and Shoulders Pattern
Effective Time Frames for Head and Shoulder Patterns
Trend reversals initiated by head and shoulder patterns are more effective on higher time frames (Daily, Weekly and Monthly time frames) of trending assets such as cryptocurrencies.
Head and shoulders patterns mostly fail into a continuation of the main trend on the lower chart time frames (M15, 1HR, 4HR) of trending assets like cryptocurrencies.
Trend Reversal Signal
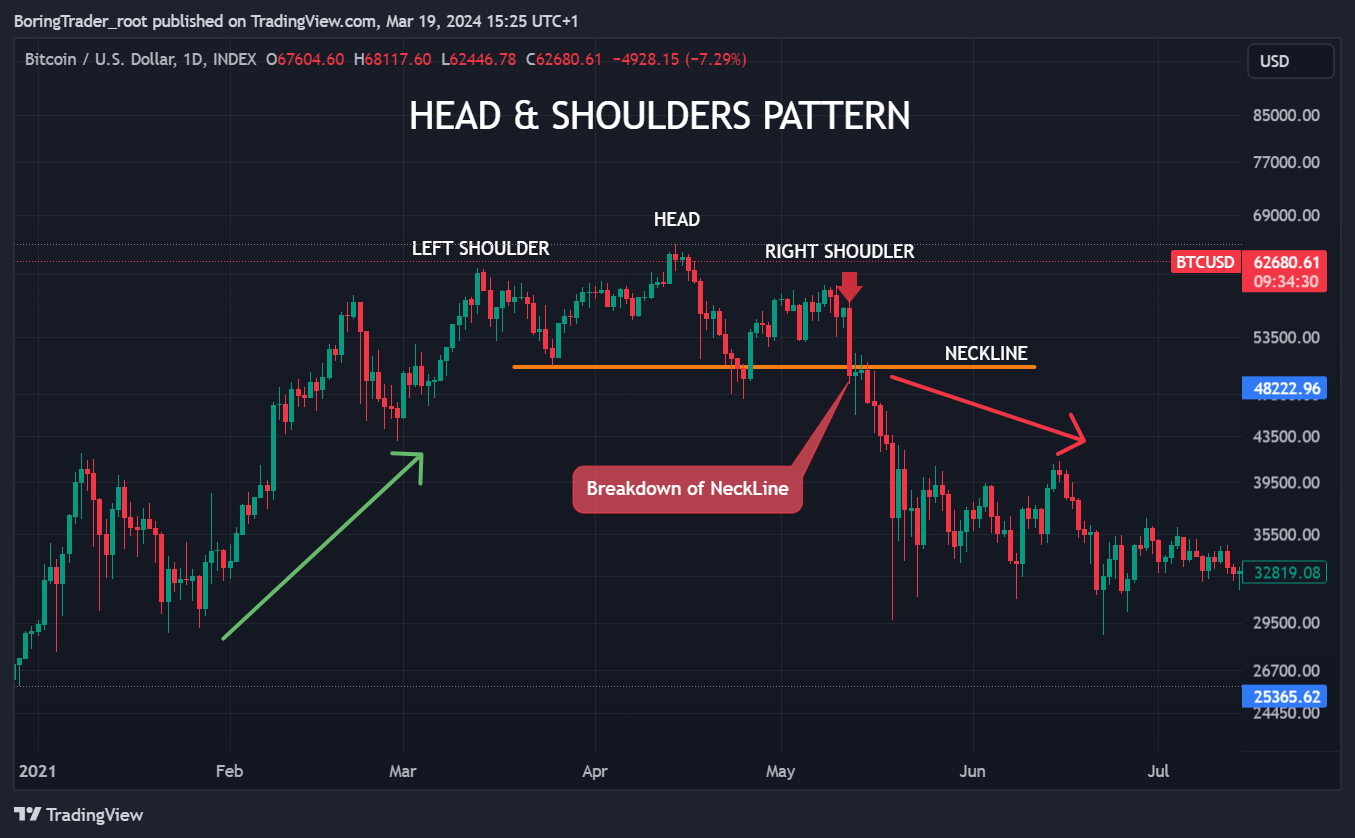
The head and shoulders pattern suggests a potential reversal of a running trend. Traders interpret this pattern as signaling a forthcoming decline in the price of an asset, characterized by three sets of peaks and troughs, with the middle peak being the highest. The neckline serves as a pivotal level where bearish traders typically commence selling.
Furthermore, this pattern implies that the emerging downward trend is likely to persist until the right shoulder is breached—marked by prices surpassing the levels seen at the right peak.
Trade Exit Signal
A trader riding the wave of a bullish trend may decide to lock in some profit upon identifying the third peak of a head and shoulders pattern.
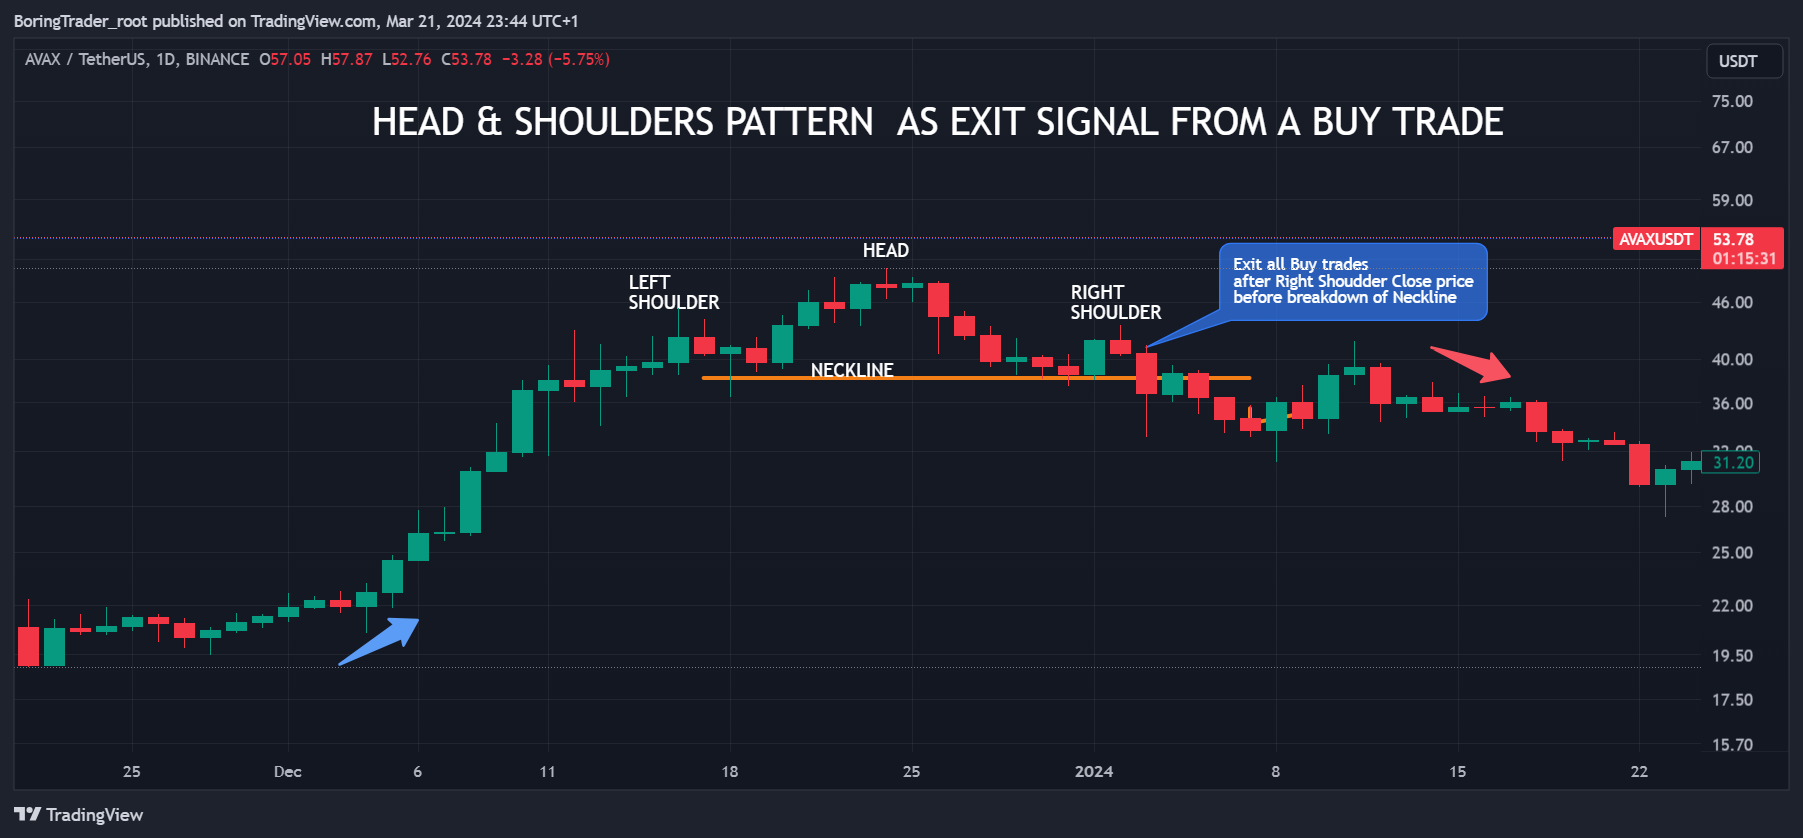
A price breakdown of the head and shoulder neck line would signal an end to the main trend, hence a forceful exit of all open trades in the direction of the trend. This may serve as a signal to enter an instant or pending order execution in the opposite direction.
Head & Shoulder Pattern as Trend Continuation Signal
Head and Shoulders Pattern as a Trend Continuation Signal [Anomaly].
Many chart patterns experience failures in certain situations, and the head and shoulders pattern is no exception.
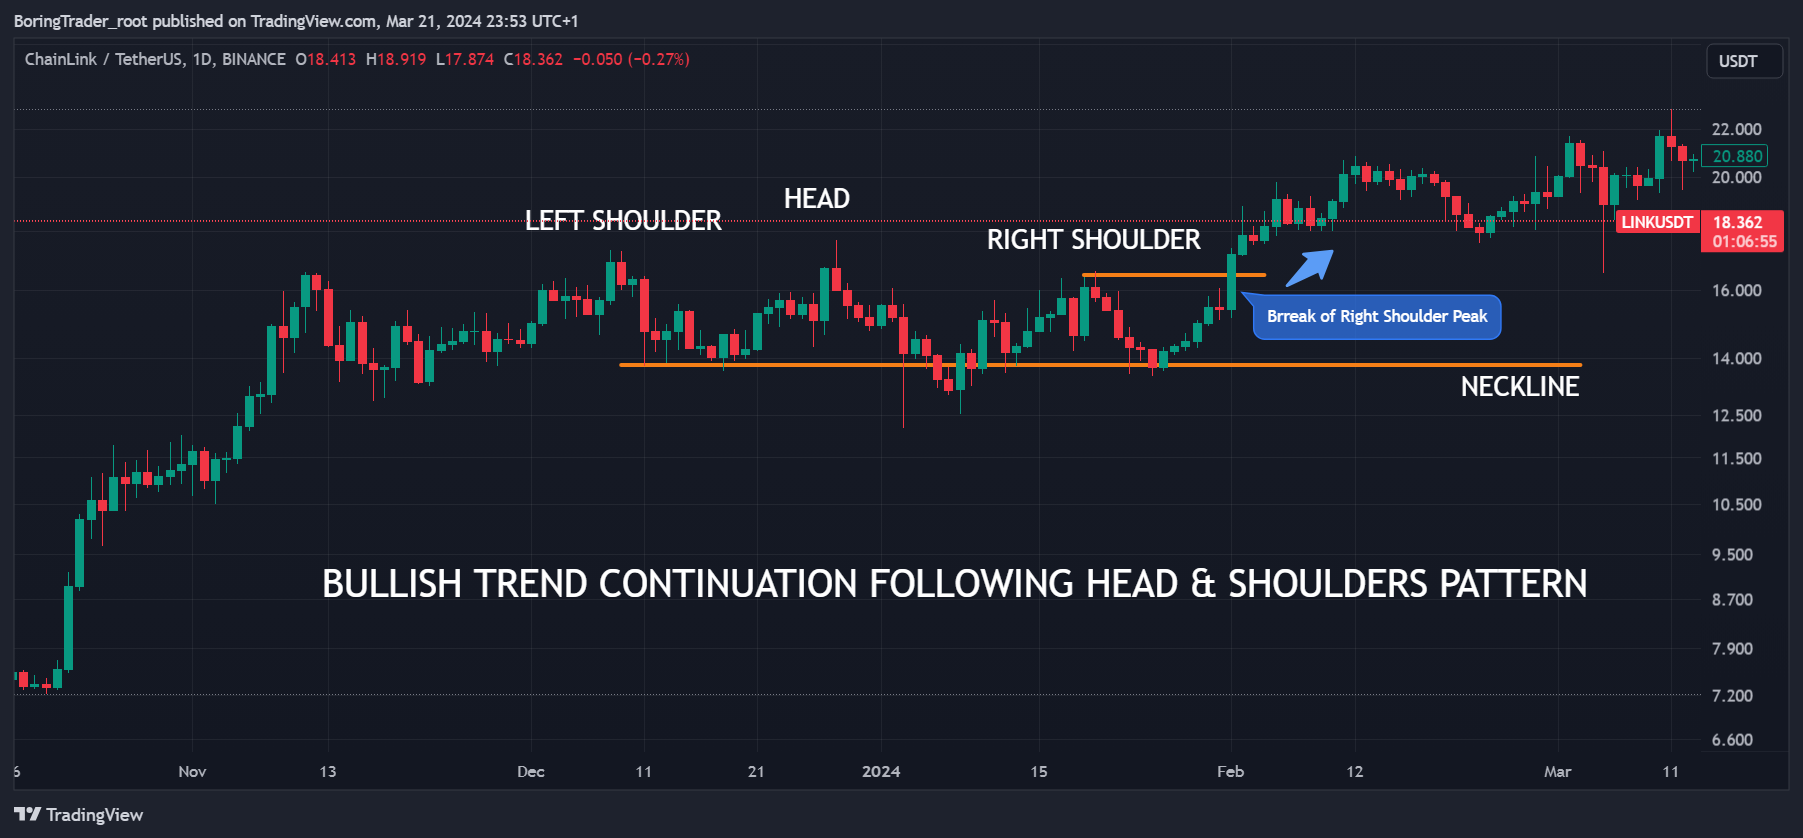
A breach of the right shoulder peak or highest peak (head) in the head and shoulders pattern may indicate a continuation or extension of the current uptrend. Such anomalies of the head and shoulders pattern are common on lower time frames of momentum/trending assets like cryptocurrencies.
Conversely, the opposite scenario applies to inverse head and shoulders patterns in a downtrend.
Pros and Cons of the Head and Shoulders Pattern
| 👍 Pros | 👎 Cons |
|---|---|
| ✅ Experienced traders easily recognize it | ❌ Novice traders may overlook it |
| ✅ Clear profit and risk parameters can be established | ❌ Potential for large stop loss distances |
| ✅ Opportunities for profiting from significant market movements | ❌ Unfavorable risk-to-reward ratios |
| ✅ Applicable across various markets |
Pros Explained
- Experienced traders identify it easily: The pattern’s distinct structure is readily recognizable by seasoned traders.
- Defined profit and risk: Entry and stop levels can be precisely determined, facilitating clear risk management.
- Big market movements can be profited from: The pattern’s relatively extended timeframe allows for substantial market movements between entry and close prices.
- Can be used in all markets: Suitable for application in both forex, stock, and cryptocurrency markets. However, it is important to validate the pattern’s win rate, risk to reward ratio, and other scenarios that may be peculiar to a tradable security.
While the head and shoulders pattern is widely acknowledged as a reliable indicator, there is no absolute assurance that the anticipated trend reversal will materialize.
Cons Explained
- Novice traders might miss it: In some cases, the head and shoulders pattern may feature a non-standard neckline, potentially confounding less experienced traders.
- Large stop loss distances possible: Extended downward movements occurring over prolonged periods can result in considerable stop distances.
- Neckline can appear to move: Price retracements may lead to retesting of the neckline, causing confusion among traders.
FAQ
What Information Does a Head and Shoulders Pattern Convey?
The head and shoulders pattern signifies a transition from a bullish to a bearish trend, suggesting that an ongoing upward trend may be showing a decline in buying power. Conversely, the inverse head and shoulders pattern signals a trend switching from down to an uptrend.
This pattern is widely regarded by investors as one of the most dependable indicators of a trend reversal. However, factors such as the time frame and nature of the asset should not be over looked when deploying the head and shoulders pattern in your trade arsenal.
How Reliable is the Head and Shoulders Pattern?
The typical entry point for traders is a breakdown of the neckline in a rising trend and a breakout of the neckline in a downtrend, establishing stop levels either above (in the case of a market top) or below (for a market bottom) the right shoulder.
Profit targets are determined by calculating the difference between the pattern’s high and low, added (for a market bottom) or subtracted (for a market top) from the breakout price. While not infallible, this system offers a logical approach to trading based on observable price movements.
Experienced traders and investors also know that there are special edge cases where the head and shoulders pattern transitions into a range bound market structure, followed by a breakout of the highest peak in the pattern, signaling a continuation of existing trend.
It is important to run a thorough back test of the head and shoulders pattern across different time frames, over significant historical data of the asset you’re interested in trading or investing in. This should put the law of large numbers in your favour, consequently increasing your win rate.
Can the Head and Shoulders Pattern Turn Bullish?
A classic head and shoulders pattern can turn bullish or resume the current uptrend if subsequent price action following the pattern breaches the highest peak of the chart structure. This nullifies the chart structure and suggests a trend continuation.
An inverse head and shoulders, also referred to as a “head and shoulders bottom,” mirrors the standard head and shoulders pattern but in an inverted manner. It is utilized to predict reversals in downtrends, serving as an indicator of a shift from a bearish to a bullish sentiment in the market.
What is an upside-down head and shoulders pattern called?
An upside-down head and shoulders pattern is commonly referred to as an “inverse head and shoulders” pattern.
The inverse head and shoulders pattern represents the head and shoulders formation flipped on its head, indicating a transition from a downtrend to an uptrend.
What are some common variations or nuances of the Head & Shoulders pattern that traders should be aware of?
Traders should be aware of several common variations and nuances of the Head & Shoulders pattern. One variation is the presence of a complex Head & Shoulders pattern, which involves additional smaller peaks or troughs within the formation, leading to a more intricate pattern.
Furthermore, traders should pay attention to the symmetry of the shoulders, as uneven shoulder heights may indicate a weaker pattern.
Another nuance to consider is the slope of the neckline, as a steep or flat neckline can impact the reliability of the pattern. Furthermore, traders should be cautious of potential false signals, where a Head & Shoulders pattern may appear but fail to result in a significant trend reversal.
It’s essential for traders to thoroughly analyze these variations and nuances to make informed trading decisions based on the Head & Shoulders pattern.
Can the Head & Shoulders pattern be used as a standalone trading strategy?
While the Head & Shoulders pattern can serve as a valuable component of a trader’s toolkit, it is typically not recommended to rely solely on this pattern as a standalone trading strategy.
Successful trading often involves considering multiple factors, such as market trends, volume, and fundamental analysis, in addition to technical patterns like the Head & Shoulders.
Utilizing the Head & Shoulders pattern alongside other technical indicators and risk management strategies can enhance its effectiveness and provide more robust trading signals.
Therefore, while the Head & Shoulders pattern can be an essential element of a trader’s analysis, it is generally advisable to incorporate it within a comprehensive trading approach rather than relying exclusively on it.
Are there any specific criteria for validating a completed Head & Shoulders pattern?
Yes, there are specific criteria that traders typically use to validate a completed Head & Shoulders pattern. These criteria include:
1. Confirmation of the neckline break: A decisive breakout below the neckline is typically considered confirmation of the pattern’s completion. Traders often look for increased volume accompanying the breakout to further validate the signal.
2. Target projection: The distance from the head to the neckline is often used to project a potential price target for the subsequent downward movement after the pattern confirmation. This target is then used to set profit objectives.
3. Retest of the neckline: After the neckline breakout, some traders look for a retest of the neckline from below as confirmation of the pattern’s validity. This retest can provide an opportunity to enter trades at favorable levels.
4. Timing considerations: Traders may also consider the duration of the pattern formation and the length of the preceding trend. A longer and more pronounced pattern formation, accompanied by a significant prior uptrend, may lend more credibility to the pattern’s validity.
By analyzing these criteria, traders can better assess the likelihood of a completed Head & Shoulders pattern and make informed trading decisions based on the pattern’s signals.