


Triple Top and Triple Bottom Explained
Triple top and triple bottom patterns are advanced chart patterns used in technical analysis to predict potential trend reversals in financial markets. These patterns are similar to double tops and bottoms but involve three peaks or troughs instead of two.
A triple top pattern forms when the price of an asset reaches a resistance level three times, failing to break through each time, before reversing direction. This pattern is considered a bearish reversal pattern, indicating that the uptrend is losing momentum and a downtrend may be imminent.
Conversely, a triple bottom pattern forms when the price of an asset reaches a support level three times, failing to break below each time, before reversing direction. This pattern is considered a bullish reversal pattern, indicating that the downtrend is losing momentum and an uptrend may be starting.
Traders can use several techniques to trade triple top and triple bottom patterns. One common strategy is to wait for the pattern to be confirmed by a breakout below the neckline (for a triple top) or above the neckline (for a triple bottom). Traders can then enter a short trade (for a triple top) or a long trade (for a triple bottom) with a stop-loss order placed above the neckline (for a short trade) or below the neckline (for a long trade) to manage risk.
Identifying Triple Tops and Bottoms
Identifying triple tops and bottoms is a key skill for traders looking to anticipate trend reversals in financial markets. These patterns are similar to double tops and bottoms but involve three peaks or troughs instead of two. Traders can follow the steps below to identify triple tops and bottoms:
1. Three Peaks or Troughs
The first step in identifying a triple top or bottom is to look for three consecutive peaks or troughs on a price chart. These peaks or troughs should be roughly equal in height or depth, respectively, indicating that the price is struggling to break through a certain level of resistance or support.
2. Line Study (TradingView )
Draw trendlines connecting the peaks or troughs to visualize the pattern more clearly. The trendlines should show a clear level of resistance (for a triple top) or support (for a triple bottom) that the price is struggling to break through.
3. Confirmation
To confirm the pattern, look for the price to break below the support level (for a triple top) or above the resistance level (for a triple bottom). This breakout confirms the reversal of the trend and can be used as a signal to enter a trade.
4. Volume
Pay attention to volume during the formation of the pattern. Typically, volume should decrease as the pattern forms and increase during the breakout, confirming the pattern’s validity.
5. Additional Indicators
Use other technical indicators, such as moving averages or momentum oscillators, to confirm the pattern. These indicators can provide additional insights into the strength of the trend reversal.
By following these steps and using proper risk management techniques, traders can effectively identify triple tops and bottoms and potentially profit from trend reversals in financial markets.
Triple Top Pattern Example
The triple top pattern is a significant technical analysis pattern that indicates a potential reversal of an uptrend into a downtrend. This pattern is characterized by three consecutive peaks at approximately the same price level, with troughs in between. Traders often look for this pattern as a signal that the uptrend is losing strength and a reversal may be imminent.
Let’s illustrate the triple top pattern considering the cryptocurrency pair JOEUSDT:
The price of a crypto pair, JOEUSDT, has been steadily rising for several days, reaching a peak of $0.41085353 per coin. After reaching this peak, the price retraces to $0.24173086 per coin, indicating a temporary pullback. However, instead of continuing higher, the price rebounds and attempts to reach the previous peak of $0.41085353 per share again. This second attempt fails, and the price retreats to $0.32733097 per coin, a higher trough compared to the first.
Following another temporary rebound, the price again fails to close above the $0.41085353 price level at the close of the day, forming the third peak.
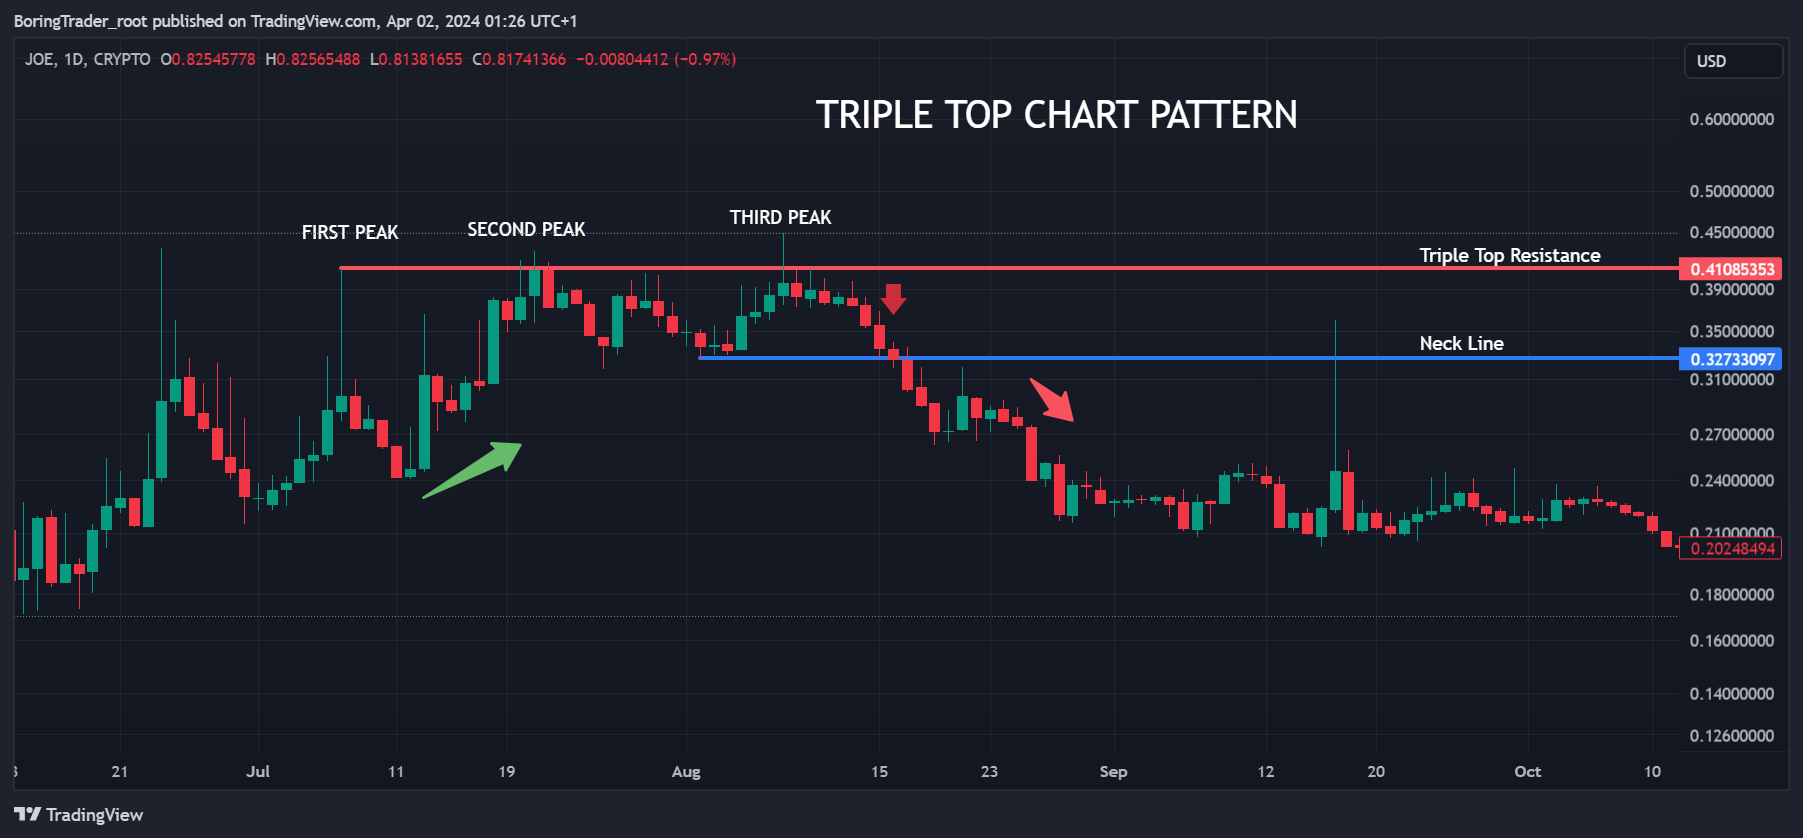
Traders who recognize this pattern may interpret it as a sign that the uptrend in JOEUSDT cryptocurrency pair is losing momentum and that a downtrend may be starting. To confirm this interpretation, traders may use additional technical indicators, such as volume analysis or momentum oscillators, to look for further evidence of a potential trend reversal.
In this example, traders who identified the triple top pattern and confirmed it with other technical indicators may have decided to take a short position in the JOEUSDT, anticipating a downtrend.
Triple Bottom Pattern Example
The triple bottom pattern is a significant technical analysis pattern that indicates a potential reversal of a downtrend into an uptrend. This pattern is characterized by three consecutive troughs at approximately the same price level, with peaks in between. Traders often look for this pattern as a signal that the downtrend is losing strength and a reversal may be imminent.
Let’s consider an example to illustrate the triple bottom pattern:
The price of the cryptocurrency, Cardano ADAUSDT, has been steadily declining for several weeks, reaching a low of $0.24 per coin. After reaching this low, the price bounces back to $60 per coin, indicating a potential reversal. However, instead of continuing higher, the price retraces back to a peak at $0.46 per coin, confirming the first trough of the triple bottom pattern.
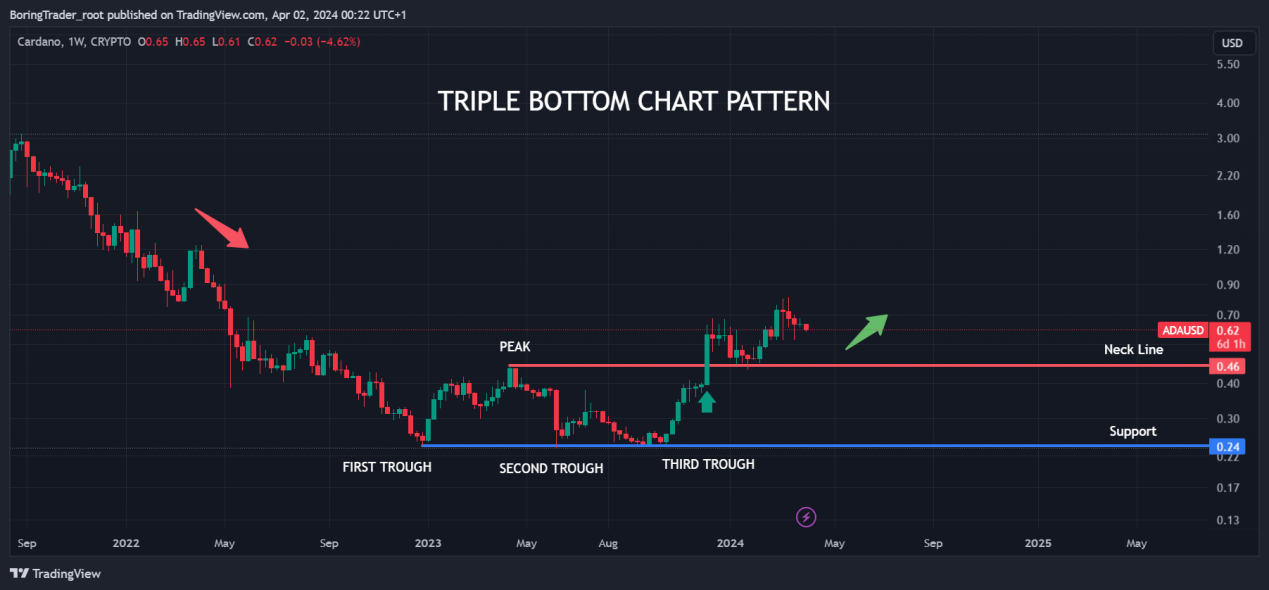
After reaching the $0.24 level again, the price once more rebounds, this time to $65 per coin. However, it fails to sustain this level and retraces back to $50 per coin, forming the second trough of the pattern. After another temporary rebound, the price again fails to break through the $0.379 per coin level, a lower peak compared to the first at $0.46 and forming the third trough, completing the triple bottom pattern.
Traders who recognize this pattern may interpret it as a sign that the downtrend in ADAUSD cryptocurrency pair is coming to an end and that an uptrend may be starting.
Traders may use additional technical indicators, such as moving averages or volume analysis, to look for further evidence of a potential trend reversal.
How To Trade Triple Tops and Bottoms
Trading triple tops and bottoms can be a rewarding strategy for traders seeking to capitalize on trend reversals in financial markets. These patterns offer clear entry and exit points, providing traders with opportunities to profit from potential price movements.
1. Identify the Pattern
The first step in trading triple tops and bottoms is to identify the pattern on a price chart. Look for three consecutive peaks (triple top) or troughs (triple bottom) that are roughly equal in height or depth, respectively, with minor price pullbacks in between.
2. Confirm the Pattern
Once you have identified a potential triple top or bottom pattern, confirm it with other technical indicators. Look for signs of weakness in the current trend, such as decreasing volume or momentum, to validate the pattern. Regular bearish or regular bullish divergence of the Relative Strength Index oscillator while the triple top pattern is forming often serves as a confirmation of the setup.
3. Entry Point
Enter a trade after the pattern has been confirmed and the price breaks below the neckline (for a triple top) or above the neckline (for a triple bottom). This breakout confirms the reversal of the trend and can be used as an entry point for a trade.
4. Stop-Loss and Take-Profit Levels
Set stop-loss orders above the neckline (for a short trade) or below the neckline (for a long trade) to limit potential losses. Take-profit orders can be set at a distance equal to the height of the pattern, measured from the neckline to the lowest (for a triple top) or highest (for a triple bottom) point of the pattern.
5. Risk Management
Manage your risk by only risking a small percentage of your trading capital on each trade. This will help protect your account from large losses.
6. Monitor the Trade
Once you have entered a trade, monitor it closely for any signs of reversal. Consider trailing your stop-loss to lock in profits as the trade moves in your favor.
By following these steps and using proper risk management techniques, traders can effectively trade triple tops and bottoms and potentially profit from trend reversals in financial markets.
Pros/Cons of the Triple Top and Bottom Pattern
The triple top and bottom pattern is a significant technical analysis pattern that can provide valuable insights into potential trend reversals in financial markets. Like any trading strategy, the triple top and bottom pattern has its pros and cons.
Pros
1. Strong Signal
The triple top and bottom pattern is considered a strong signal of a potential trend reversal. The formation of three peaks or troughs at approximately the same price level indicates a significant struggle between buyers and sellers, making the pattern more reliable.
2. Clear Entry and Exit Points
The pattern provides clear entry and exit points for traders. Traders can enter a trade after the pattern is confirmed and the price breaks below the neckline (for a triple top) or above the neckline (for a triple bottom), providing a clear entry point. Similarly, traders can set stop-loss orders above the neckline (for a short trade) or below the neckline (for a long trade) to limit potential losses.
3. Profit Potential
Trading the triple top and bottom pattern can offer significant profit potential. If the pattern is confirmed and the trend reversal occurs as expected, traders can profit from the subsequent price movement.
4. Versatility
The triple top and bottom pattern can be applied to various timeframes and markets, making it a versatile tool for traders.
Cons
False Signals
Like any technical analysis tool, the triple top and bottom pattern is not foolproof and can sometimes produce false signals. Traders should use additional technical indicators to confirm the pattern before entering a trade.
In addition, traders should test the inherent nature of the financial asset they intend to trade, separating bullish tests from bearish tests. For example, the triple bottom pattern may be more reliable when trading cryptocurrency pairs, considering its bullish seasonality.
Complexity
Compared to simpler patterns such as double top and bottom, identifying the triple top and bottom pattern can be more complex. This complexity can lead to confusion and inconsistent trading decisions among newbie traders.
Whipsaws
In fast-moving markets, the triple top and bottom pattern can sometimes result in whipsaws, where the price briefly breaks below or above the neckline before reversing direction. This can lead to losses for traders who are not quick to react.
Risk of Missing Out
While waiting for confirmation of the pattern, traders risk missing out on potential profits if the trend reversal occurs before the pattern is confirmed.