


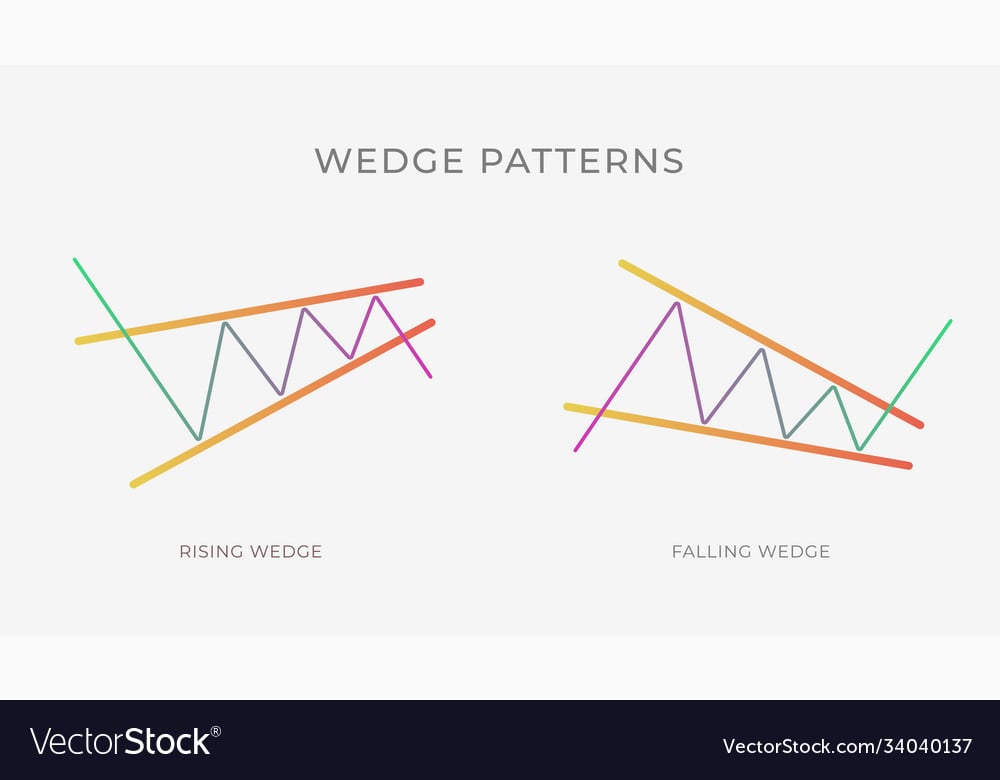
On a price chart, converging trend lines indicate the presence of a wedge pattern. Trading instruments such as stocks, cryptocurrencies, bonds, futures, etc., typically exhibit the wedge pattern. A wedge-shaped pattern formed by two trend lines convergent towards one another gives the pattern its distinctive appearance.
A wedge pattern is identified by two trend lines connecting a series of corresponding price highs and lows over a short timeframe. It is called a wedge pattern because the chart candles form a wedge-like shape as they get closer to convergence. This usually means that the highs and lows either increase or decrease at different rates. Technical analysts view trend lines with a wedge form as helpful signs of a possible reversal in price action.
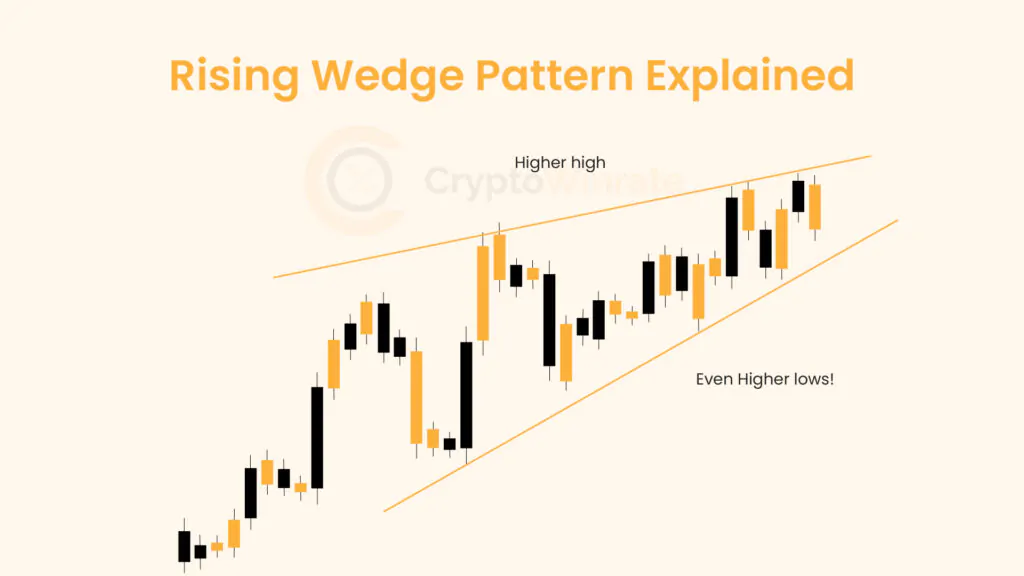
The rising wedge pattern is characterized by a narrowing price range enclosed within a pair of trend lines sloping upwards. A complete rising wedge pattern has these three qualities: convergent trendlines, a tendency for the volume to decrease as the price moves through the pattern, and a breakout from one of the trend lines.
Rising Wedge Pattern Examples
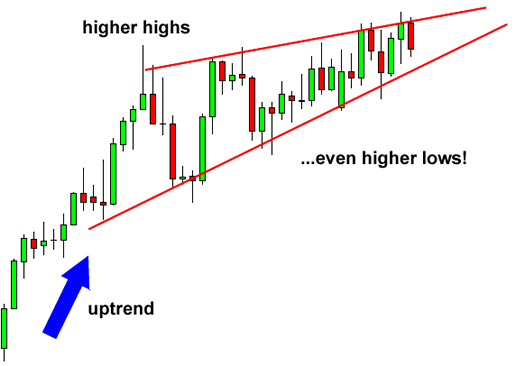
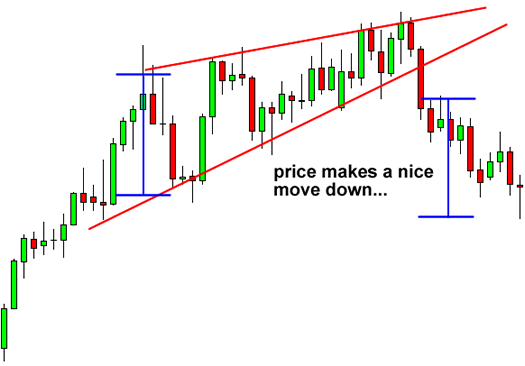
1. Formed from the end of an uptrend
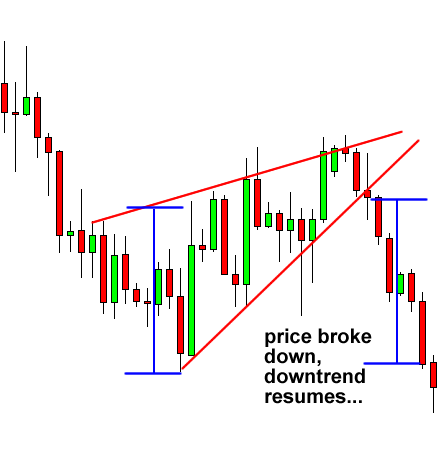
2. Formed from a downtrend
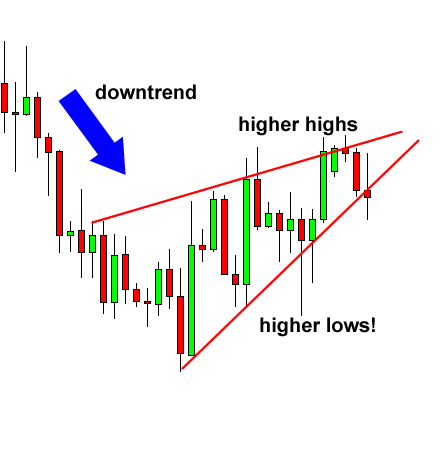
In both cases, the market continued in a downtrend after the breakouts, as seen below.
Is the Rising Wedge Pattern Bullish?
A rising wedge that forms during a downtrend usually results in a continuation of the downtrend. In contrast, an increasing wedge that forms after an uptrend usually leads to a reversal, i.e., a downtrend.
So to speak, the rising wedge is a bearish chart pattern.
How to Trade the Rising Wedge Pattern
One of the many techniques in technical analysis is the rising wedge pattern, which frequently indicates a possible move in an investment or the larger market. The pattern can be identified by looking for a decreasing range of prices surrounded by two trendlines that converge in an upward direction over time.
To optimize the predictive utility of the pattern, it is imperative to employ risk management measures and validate the pattern using additional technical analysis indications. Identifying and trading the rising wedge pattern can give traders—day traders, swing traders, or long-term investors—intelligent indications for entering and exiting the market.
Finding the chart’s rising wedge pattern is the first step. Converging trendlines with upward slopes and higher highs and lows are what an investor or trader would seek out. Usually, the pattern develops amid a rising trend.

The investor or trader will await confirmation before making a move. Usually, this manifests as a price breakout that falls below the lower trendline. Another piece of evidence that the wedge is forming correctly is a decreasing volume.
Traders frequently open a short position when the pattern is verified. The entry point is at the point of breakout below the lower trendline. One places a stop loss just above the pattern’s most recent peak. This reduces the amount of money lost if the pattern breaks and the price swings in the opposite direction.
Typically, the pattern’s height at its broadest point is measured, and that amount is subtracted from the breakout level to establish the price target. Fibonacci retracement levels are additional targets that some traders use to fine-tune their exit strategy.
When trading the rising wedge pattern, risk management is essential. This entails determining suitable position sizes and verifying the pattern with additional technical analysis indicators, like the Moving Average Convergence Divergence or Relative Strength Index.
Traders usually exit the position after the price meets the predetermined target. Nonetheless, it is prudent to monitor additional technical analysis indications and market news that may impact price.
False breakouts are a risk when trading the rising wedge pattern. Occasionally, the price may breach the downward trendline before swiftly turning back. As a result, traders ought to hold off until a bar or candle closes below the trendline. This provides one more level of assurance.
Context is important, which is another warning. The rising wedge pattern’s performance can change depending on the asset’s unique characteristics or the market’s overall state. When the indications coincide with other bearish signals or market mood, they become more dependable.
Pros and Cons of the Rising Wedge Pattern
Technical analysis traders can greatly benefit from trading with rising wedge patterns. The main benefits of wedge patterns are listed below:
- Aids merchants in illustrating price movement. In technical analysis, analysts depict price movements and significant market patterns using a wedge.
- Simple to recognize. Due to their relative ease of recognition on a price chart, rising wedge patterns are accessible to novice traders. It is simpler to spot possible trend reversals since they are created by two trend lines that converge in the same direction.
- Combined with additional technical signs. Rising wedge patterns are used with other technical indicators, such as oscillators or moving averages, to suggest a likely trend reversal.
- Stop loss positions near the point of entrance. This pattern has a benefit over others in that when the price hits your target, your peak loss placement will often be near your entry level, increasing your returns.
In technical analysis, deceptive breakouts, short time frames, and a lack of volume confirmation are the main drawbacks of wedge patterns.
- Deceptive breakouts. Sometimes, rising wedge formations produce false breakouts, in which prices briefly rise over the wedge boundary before swiftly reversing direction. Trades based on the breakout signal result in losses for the traders.
- Time constraint. Since rising wedge patterns are often short-term price formations, they are not helpful to traders looking for longer-term trends or indicators.
- Insufficient confirmation signals. Although rising wedge patterns can help predict future price changes, increasing trading volume does not always imply the correct signal.