

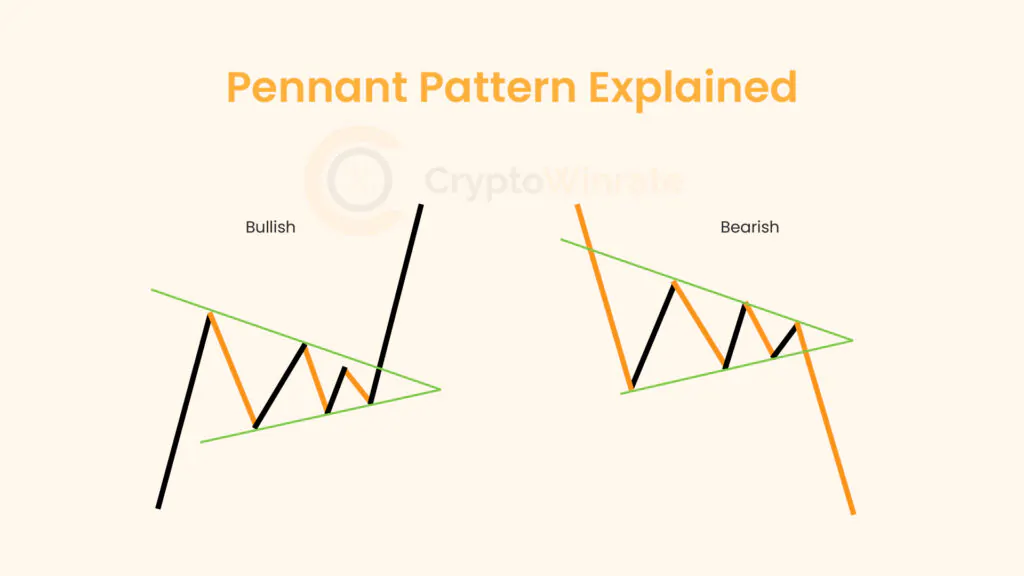
Pennant Pattern Explained Bullish vs Bearish Pennant Pattern
The pennant pattern is a common technical analysis pattern that traders use to identify potential trend continuation in financial markets. It consists of a flagpole, representing a strong price movement, followed by a period of consolidation forming a small converging triangle formed by two opposing descending and ascending trend lines known as the pennant. Depending on the nature of the financial asset class being traded, this pattern may be considered a short-term or long term continuation pattern. It indicates that the previous price trend is likely to continue after the consolidation period. Traders often look for volume confirmation when trading the pennant pattern to validate the potential continuation of the trend.
The bullish and bearish pennant patterns are both continuation patterns that occur after a strong price movement, but they have opposite implications for price direction.
The bullish pennant pattern is characterized by converging down slope and up slope trend lines, forming a triangle (the pennant) that forms after a strong upward price movement (the flagpole). The pennant represents a period of consolidation before the price typically continues its upward trend. Traders often interpret this pattern as a bullish signal, anticipating a continuation of the uptrend.
On the other hand, the bearish pennant pattern is the opposite of the bullish pennant. It forms after a strong downward price movement (the flagpole) and is characterized by descending peaks and ascending troughs that form a small symmetrical triangle (the pennant). Similar to the bullish pennant, the bearish pennant represents a period of consolidation before the price typically continues its downward trend. Traders interpret this pattern as a bearish signal, expecting a continuation of the downtrend.
The key difference between the bullish and bearish pennant patterns lies in the direction of the preceding price movement and the anticipated direction of the continuation. The bullish pennant occurs after an uptrend and signals a potential continuation of the uptrend, while the bearish pennant occurs after a downtrend and signals a potential continuation of the downtrend.
Bullish Pennant Example
Considering the daily time frame of the cryptocurrency pair, Solana/U.S. Dollar that assumed a strong uptrend, reaching a high of $68.15. After this rapid ascent, the cryptocurrency enters a period of consolidation, forming a bullish pennant pattern.
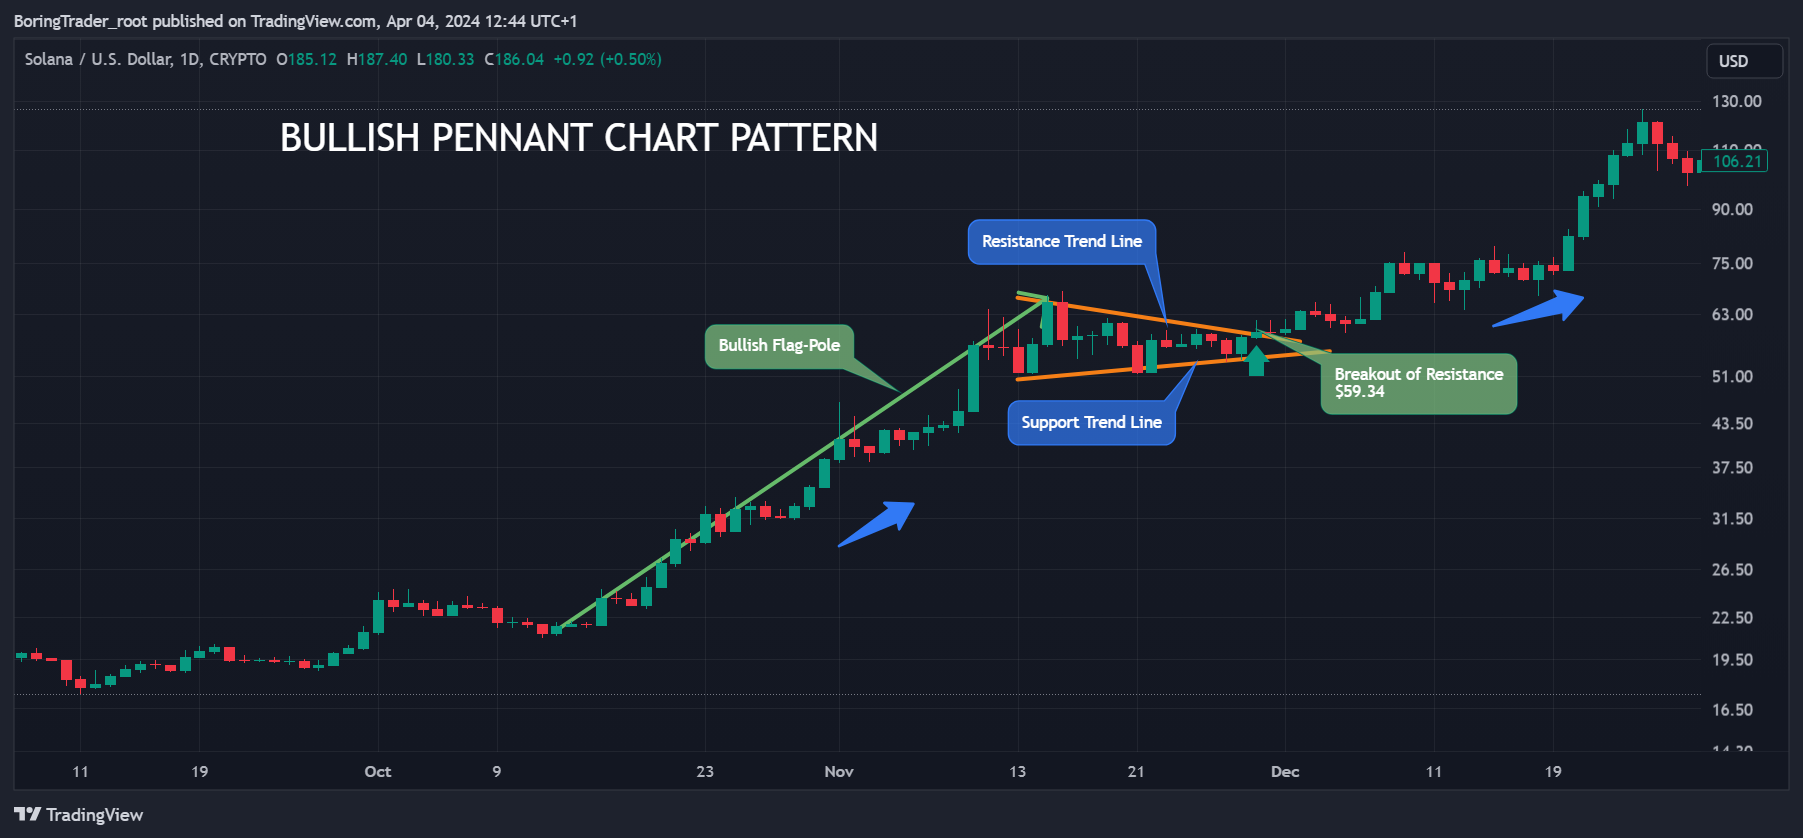
Traders observing this pattern identify the flagpole, which is the initial sharp rise from $20.97 to $68.15, and the subsequent pennant, characterized by lower highs and higher lows, trading within a narrowing triangle with declining resistance at $65.53, $61.12, and $58.85; and opposing rising supports at $51.65, $51.71, and $55.08.
To trade this pattern, a trader should wait for a breakout above the upper resistance trendline of the pennant, which could signal a continuation of the uptrend. They could enter a long position at $59.34, just above the breakout point, with a stop-loss order placed below the lower trendline at $50.70 to manage risk.
Assuming a conservative price target based on the height of the flagpole, the trader might set a profit target at $187.38. This would represent a potential profit with a risk-reward ratio of 1:13, making it an attractive trade opportunity.
Bearish Pennant Example
Let’s consider the Binance Coin (BNB) / U.S Dollar from a weekly chart perspective, that has been experiencing a downtrend, dropping from $17.4 to $8.5. This decline is followed by a period of consolidation, forming a bearish pennant pattern.
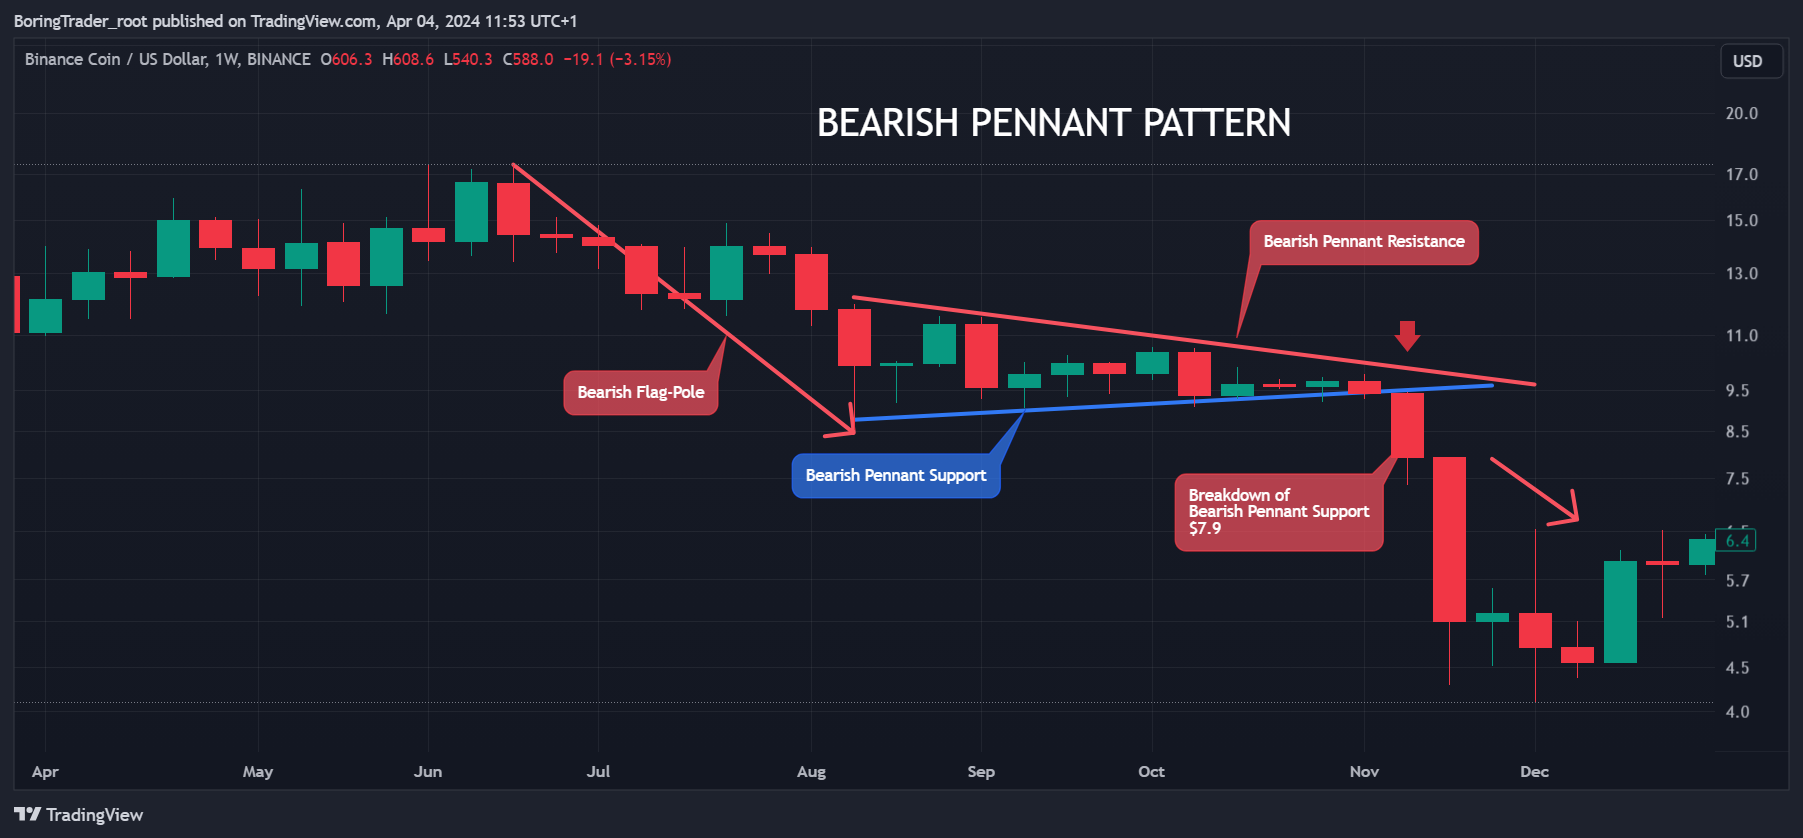
Traders watching this pattern identify the bearish flagpole, representing the initial sharp drop from $17.4 to $8.5, and the subsequent pennant, characterized by lower highs and higher lows, trading within a narrowing range. The price trades within the consolidating range setting declining highs set by a bearish trend line at $12.0, $11.6, $10.7, $9.8; and ascending support trend line at $8.5, $9.0, and $9.3 respectively.
To trade this pattern, a trader might wait for a breakout below the lower trendline of the pennant, which could signal a continuation of the downtrend. They could enter a short position at $7.9, just below the breakout point, with a stop-loss order placed above the upper trendline at $10.0 to manage risk.
Assuming a conservative price target based on the height of the flagpole, the trader might set a profit target at $4.3. This would represent a potential profit with a risk-reward ratio of 1:1.6, making it a favorable trade opportunity.
Key Factors of the Pennant Chart Pattern
The pennant chart pattern is a specific price formation of any asset in technical analysis that takes the form of a flag, used by traders to identify potential continuation patterns in financial markets. Several key factors characterize this pattern:
- Flagpole: The flagpole is the initial sharp price movement that precedes the formation of the pennant. It represents the strong directional move that is typically seen before the pattern forms.
- Pennant Formation: The pennant is a convergence of descending and ascending trend lines in most cases forming a symmetrical triangle that takes the shape of a flag, after the flagpole. It is characterized by lower highs and higher lows, indicating a period of consolidation or indecision in the market.
- Volume: Volume is an important factor in confirming the validity of the pennant pattern. Traders look for an increase in volume during the flagpole and a decrease in volume during the formation of the pennant.
- Duration: The duration of the pennant pattern is also important. A longer period of consolidation within the pennant is generally seen as more reliable than a shorter period.
- Breakout: The breakout is the point at which the price breaks out of the pennant pattern, indicating a potential continuation of the previous trend. Traders often look for a breakout above the resistance trend line or below the support trend line of the pennant with increased volume to confirm the pattern.
- Target: The price target for the pennant pattern is often measured by taking the height of the flagpole and adding it to the breakout point. This gives traders an idea of how far the price may move after the breakout. As the range of the flagpole is generally greater than the range of the pennant, traders favor this pattern for its potential to offer risk to reward ratios that’s greater than 1:1.
- Risk Management: As with any trading strategy, risk management is crucial when trading the pennant pattern. Traders should set stop-loss orders to limit potential losses if the trade does not go as planned. Stop loss levels can be set at the lowest support in the pennant pattern in the case of an uptrend, and the highest resistance of the pennant in the case of a downtrend.
Understanding these key factors can help traders identify and trade the pennant pattern effectively, potentially leading to profitable trading opportunities.
How to Trade the Pennant Pattern
Trading the pennant pattern can be a lucrative strategy for traders looking to capitalize on short-term price movements. This pattern, characterized by a flagpole followed by a period of consolidation forming a small symmetrical triangle known as the pennant, is often seen as a continuation pattern, indicating that the previous trend is likely to continue. To trade the pennant pattern effectively, traders should follow these steps:
Identify the Pattern
The first step is to identify the pennant pattern on the price chart. Look for a sharp price movement (flagpole) followed by a period of consolidation where the price forms the pennant.
Confirm the Pattern
Confirm the pattern by analyzing volume. Typically, you should see an increase in volume during the flagpole and a decrease in volume during the formation of the pennant.
Enter the Trade
Enter a long position if the price breaks out above the upper trendline of the pennant. Alternatively, enter a short position if the price breaks out below the lower trendline. Some traders may wait for a retest of the trendline before entering the trade for added confirmation.
Set Stop-Loss
Place a stop-loss order below the lower trendline for long trades and above the upper trendline for short trades. This helps to manage risk in case the breakout fails.
Take Profit
Set a profit target based on the height of the flagpole. Measure the distance from the start of the flagpole to the top and add this distance to the breakout point for long trades. For short trades, subtract this distance from the breakout point.
Monitor the Trade
Once the trade is executed, monitor it closely. Adjust the stop-loss and take-profit levels as the trade progresses, and be prepared to exit if the price fails to follow through with the expected continuation.
FAQ
What is the pennant pattern?
The pennant pattern is a technical analysis pattern that indicates a short-term continuation in price movement. It is characterized by a flagpole, representing a sharp price movement, followed by a period of consolidation forming a small symmetrical triangle known as the pennant.
How do I trade the pennant pattern?
To trade the pennant pattern, traders typically wait for a breakout above the upper trendline of the pennant for a long trade or below the lower trendline for a short trade. Entry is often made at the breakout point, with stop-loss orders placed below the lower trendline for long trades and above the upper trendline for short trades.
How reliable is the pennant pattern?
The reliability of the pennant pattern depends on various factors, including the context in which it appears and the confirmation signals observed. Traders often use volume analysis and other technical indicators to confirm the pattern’s validity before entering a trade.
What is the profit target for the pennant pattern?
The profit target for the pennant pattern is often calculated by measuring the height of the flagpole and adding it to the breakout point for long trades or subtracting it for short trades. This gives traders an idea of how far the price may move after the breakout.
Can the pennant pattern occur in different timeframes?
Yes, the pennant pattern can occur in various timeframes, from intraday charts to daily and weekly charts. Traders should adjust their analysis based on the timeframe to ensure the pattern’s accuracy.
What are some common mistakes to avoid when trading the pennant pattern?
Some common mistakes to avoid include trading the pattern without confirmation signals, entering trades too early, and failing to use proper risk management techniques such as stop-loss orders.
Can the pennant pattern indicate a reversal instead of a continuation?
While the pennant pattern is typically seen as a continuation pattern, it can sometimes indicate a reversal. Traders should look for additional confirmation signals, such as a break in trendline support or resistance, to determine the likelihood of a reversal.
How long does it typically take for the pennant pattern to form?
The duration of the pennant pattern can vary, but it is generally a short-term pattern that forms over a period of days to weeks. Traders should be patient and wait for the pattern to fully develop before entering a trade.
Are there other patterns similar to the pennant pattern?
Yes, there are several patterns that are similar to the pennant pattern, such as the flag pattern and the triangle pattern. While these patterns have similarities, they have distinct characteristics that differentiate them from the pennant pattern.
Is the pennant pattern more effective on certain timeframes?
The pennant pattern can be effective on various timeframes, from intraday charts to daily and weekly charts. Traders should adjust their analysis based on the timeframe to ensure the pattern’s accuracy.
Can the pennant pattern occur in both bullish and bearish markets?
Yes, the pennant pattern can occur in both bullish and bearish markets. In a bullish market, the pennant pattern indicates a potential continuation of the uptrend, while in a bearish market, it indicates a potential continuation of the downtrend.
Should traders use other technical indicators with the pennant pattern?
While the pennant pattern can be traded on its own, some traders prefer to use other technical indicators, such as moving averages or relative strength index (RSI), to confirm the pattern’s validity. These indicators can provide additional confirmation of the expected price movement.