

Ascending triangles serve as valuable chart patterns for traders, offering insights into market sentiment and potential price movements. By understanding the key characteristics and signals of ascending triangles, you’ll gain the knowledge and confidence needed to capitalize on profitable trading opportunities.
In this comprehensive guide, we look into identifying and effectively trading this bullish continuation pattern. Join us to learn more about ascending triangles and unlock their trading potential.
What is an Ascending Triangle?
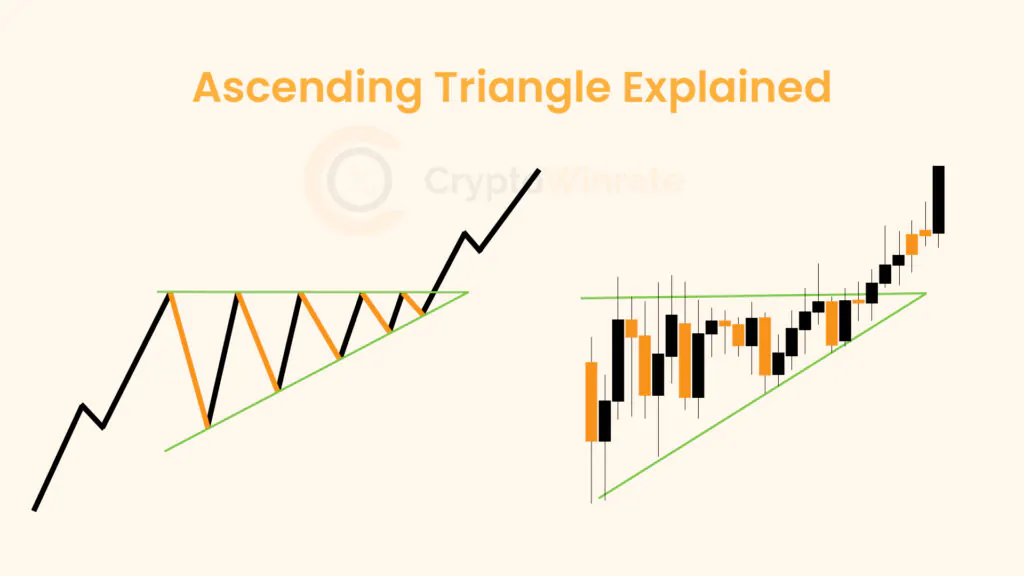
An ascending triangle in trading chart patterns is a bullish formation that usually forms during an uptrend. It’s characterized by a flat upper trend line that acts as resistance and an ascending lower trend line that serves as support, which converges as the pattern develops. This pattern suggests that buyers are more aggressive than sellers, as evidenced by higher lows, but face resistance at a certain price level.
The ascending triangle is considered a continuation pattern, meaning it signals that the prior uptrend is likely to resume once the price breaks above the resistance level. Traders often watch for a decisive breakout above the upper trend line on increased volume as a confirmation of pattern completion and may use this as an opportunity to enter a long position.

Ascending Triangle Examples
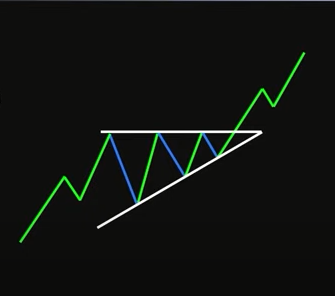
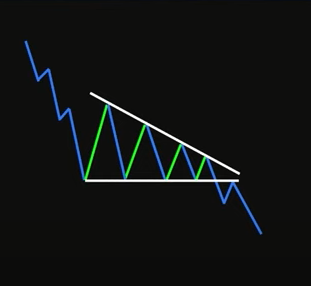
Ascending triangle patterns can be observed across various financial markets and cryptocurrencies. Here is an example to illustrate how ascending triangles might manifest in trading:

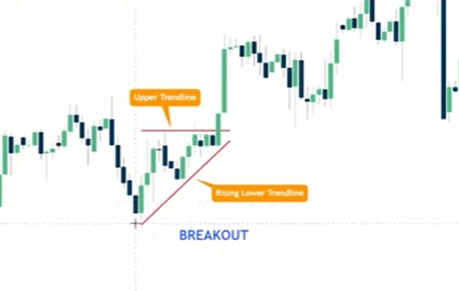
In the image, we observe an ascending triangle chart pattern, characterized by a rising lower trendline and a flat upper resistance line. This pattern signifies a bullish continuation, indicating increasing buying pressure. Traders eye a breakout entry point, typically occurring when the price breaches the upper resistance line. This breakout signals a potential bullish momentum. To manage risk, a stop-loss order is often placed just below the ascending trendline to mitigate losses if the breakout fails.
Upon breakout confirmation, traders initiate a buy position, anticipating further upward movement. Take-profit levels are set based on the pattern’s height or at key resistance levels beyond the breakout point, aiming to capitalize on the anticipated uptrend. This strategy leverages technical analysis to identify potential profitable trading opportunities within the market. Traders and investors often use these patterns to make informed decisions about entry and exit points in the market.
How to Trade the Ascending Triangle
Trading an ascending triangle involves recognizing the pattern early and making strategic decisions based on its bullish continuation signal. Here are steps and considerations for trading an ascending triangle:
1. Identification: First, identify the ascending triangle pattern on the chart. Look for a horizontal resistance line where the price has hit and bounced off multiple times, and an ascending trend line where the price forms higher lows. The volume may decrease as the pattern develops, which is typical for consolidation phases.
2. Wait for Breakout: The key to trading ascending triangles is patience; wait for a convincing breakout above the resistance level. A breakout is confirmed if the price closes above the resistance level, ideally on increased volume. The increase in volume suggests strong buying pressure and supports the validity of the breakout.
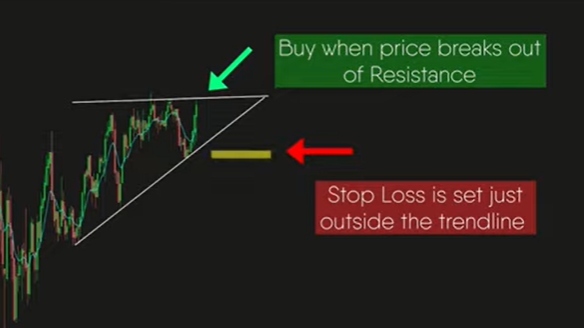
3. Entry Point: Once a breakout is confirmed, consider entering a long (buy) position. Some traders might enter as soon as the price breaks above the resistance, while others may wait for a retest of the breakout level, where the former resistance level becomes support.
4. Stop-Loss Order: To manage risk, place a stop-loss order just below the ascending trend line or the most recent low within the triangle. This limits potential losses if the breakout fails and the price reverses.
5. Take Profit: Set a take-profit level to secure profits. A common approach is to measure the height of the triangle at its widest part and then project that distance upwards from the breakout point to determine a target price. However, consider adjusting your target based on market conditions and resistance levels above the breakout point.
6. Monitoring: After entering the trade, monitor the price action closely. If the breakout doesn’t proceed as expected or market conditions change, be ready to adjust your strategy, including possibly exiting the position early to preserve capital.
Note: Remember, no pattern guarantees success, and it’s crucial to use ascending triangles as part of a broader trading strategy that includes risk management principles, analysis of market conditions, and other technical indicators to confirm the signals.
Pros & Cons of the Ascending Triangle Pattern
| 👍 Pros | 👎 Cons |
|---|---|
| ✅ Bullish continuation signal during an uptrend | ❌ False breakouts can occur, leading to losses for traders who enter positions prematurely |
| ✅ Clearly defined support and resistance levels aid in setting stop-loss and take-profit levels | ❌ Patterns may take time to develop, requiring patience and careful monitoring |
| ✅ Provides a visual representation of increasing buying pressure | ❌ The pattern's effectiveness can decrease in volatile market conditions or during periods of low trading volume |
| ✅ Offers potential entry points for traders looking to join an established uptrend | |
| ✅ Breakout confirmation above the resistance level is often accompanied by increased volume, adding validation to the pattern | |
| ✅ Take profits targets are obvious by using the measuring strategies |
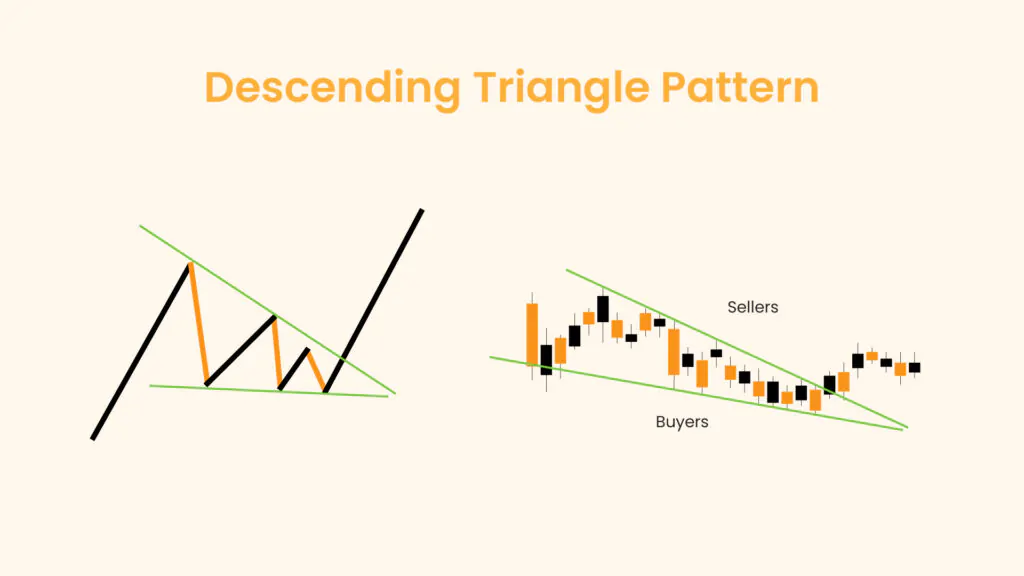
Ascending vs Descending Triangle Difference
The main difference between an ascending triangle and a descending triangle chart pattern lies in their directional implications and structure.
An ascending triangle is a bullish continuation pattern formed during uptrends. It features a flat upper trendline acting as resistance and a rising lower trendline serving as support. This pattern suggests increasing buying pressure as buyers continue to push the price higher, leading to a potential breakout above the resistance level.
On the other hand, a descending triangle is a bearish continuation pattern seen in downtrends. It comprises a flat lower trendline acting as support and a declining upper trendline acting as resistance. This pattern indicates increasing selling pressure as sellers continue to drive the price lower, potentially resulting in a breakdown below the support level.
In summary, while ascending triangles signal bullish continuation, descending triangles signal bearish continuation, based on their respective trend directions and structure.
In a Nutshell
Mastering the ascending triangle pattern is a useful skill for traders seeking to capitalize on bullish market trends. By understanding its formation, identifying key support and resistance levels, and employing proper entry and exit strategies, traders can effectively utilize this pattern to enhance their trading decisions and potentially maximize profits in the financial markets.