


Double Top and Double Bottom Explained
These chart patterns are crucial in technical analysis, offering insights into a security’s or investment’s movements (Stocks, FX, Cryptocurrencies, metals) and serving as valuable components of trading strategies. Double tops and bottoms are pivotal In technical analysis, guiding traders in their decision-making processes.
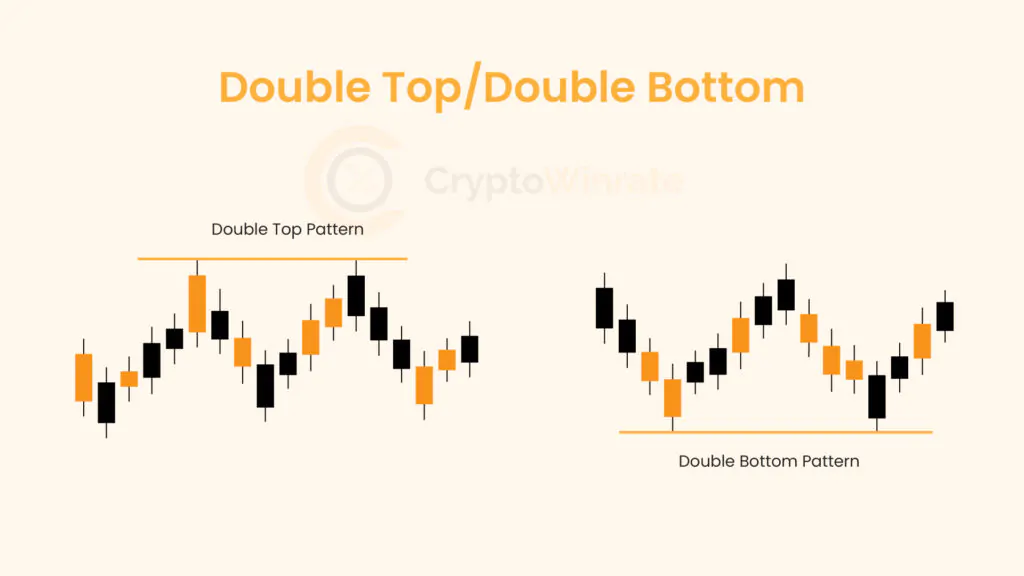
A double top is characterized by its ‘M’ shape, signaling a potential bearish trend reversal. Conversely, a double bottom displays a ‘W’ shape, indicating a possible bullish price movement. These patterns indicate areas where the market has attempted but failed to breach a support (double bottom) or resistance level (double top) twice.
A double top typically forms after an initial surge to a resistance level, followed by a failed second attempt, leading to a reversal in trend. On the other hand, a double bottom occurs when the price tries and fails to break through a support level, rebounds, and then makes a second unsuccessful attempt to breach the support level. This often signals a trend reversal.
Identifying Double Tops and Bottoms
Double top and double bottom patterns are key chart patterns used in technical analysis to forecast trend reversals in financial markets. These patterns are formed when the price of an asset reaches a high (double top) or low (double bottom) price level twice before reversing direction. Recognizing these patterns can provide traders with valuable insights into potential market movements.
To identify a double top pattern, traders should look for two distinct peaks in the price of an asset, separated by a temporary decline known as the “valley.” The two peaks should be roughly equal in height and be followed by a breakout below the “valley,” indicating a potential trend reversal. Traders often use additional technical indicators, such as volume analysis or momentum oscillators, to confirm the pattern.
Conversely, a double bottom pattern is identified by two distinct troughs in the price of an asset, separated by a temporary rise known as the “peak.” The two troughs should be roughly equal in depth and be followed by a breakout above the “peak,” signaling a potential trend reversal. As with the double top pattern, traders may use additional technical indicators to confirm the pattern’s validity.
When trading double top and double bottom patterns, it is important to wait for confirmation before entering a trade. This can help reduce the risk of false signals and improve the likelihood of successful trades. Traders should also consider the overall market context and use other technical analysis tools to support their trading decisions.
Identifying double top and double bottom patterns can be a valuable skill for traders looking to anticipate trend reversals in financial markets. By understanding how these patterns form and using them in conjunction with other technical analysis tools, traders can enhance their trading strategies and potentially improve their trading outcomes.
Double Top Pattern Example
Traders often look for this pattern as a signal that the uptrend is losing strength and a downtrend may be imminent.
Let’s consider an example, referencing the weekly time frame of the BTCUSD to illustrate the double top pattern:
The price of the cryptocurrency pair BTCUSD, has been in an uptrend for several weeks, reaching a peak of $69,791 per coin. After reaching this peak, the price retraces to $28,800 per coin, indicating a temporary pullback.
However, instead of continuing higher, the price rebounds and attempts to reach the previous peak of $69,791 per coin again. This second attempt fails, and the price begins to decline, breaking below the recent low of $28,800 per coin. This sequence of events forms the double top pattern.
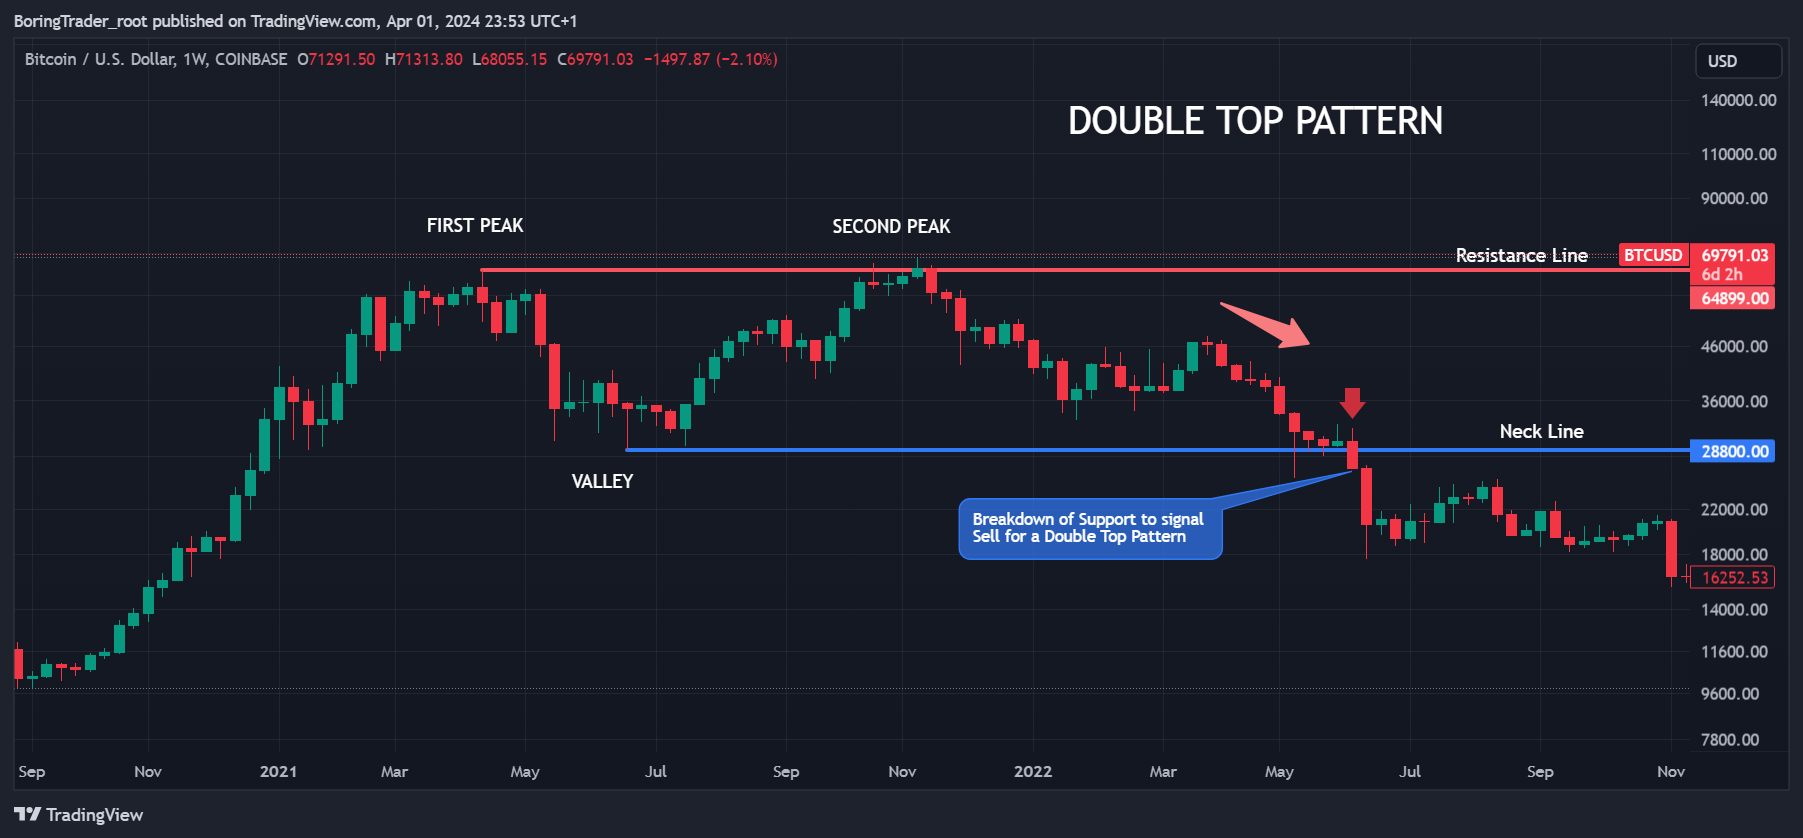
Traders who recognize this pattern may interpret it as a sign that the uptrend in BTCUSD cryptocurrency pair is weakening and that a downtrend may be starting. To confirm this interpretation, traders may use additional technical indicators, such as volume analysis or momentum oscillators, to look for further evidence of a potential trend reversal.
In this example, traders who identified the double top pattern and confirmed it with other technical indicators such as Bearish RSI divergence, may have decided to take a short position in the BTCUSD cryptocurrency , anticipating a downtrend.
Here, we demonstrate how the double top pattern can be used as a valuable tool in trading strategies to identify potential trend reversals and making informed trading decisions.
Double Bottom Pattern Example
The double bottom pattern is a widely recognized chart pattern in technical analysis that signals a potential reversal of a downtrend into an uptrend. This pattern is characterized by two consecutive troughs that are roughly equal in price, separated by a peak. Traders often look for this pattern as a sign that the downtrend may be losing momentum and a new uptrend may be beginning.
Let’s consider an example to illustrate the double bottom pattern:
Again, referencing the weekly price chart of the BTCUSD, you’ll notice it has been steadily declining for several weeks, reaching a low of $166.45. After reaching this low, the price bounces back to $311.14, indicating a potential reversal.
However, instead of continuing higher, the price retraces back to $166.45, forming the second trough of the double bottom pattern.
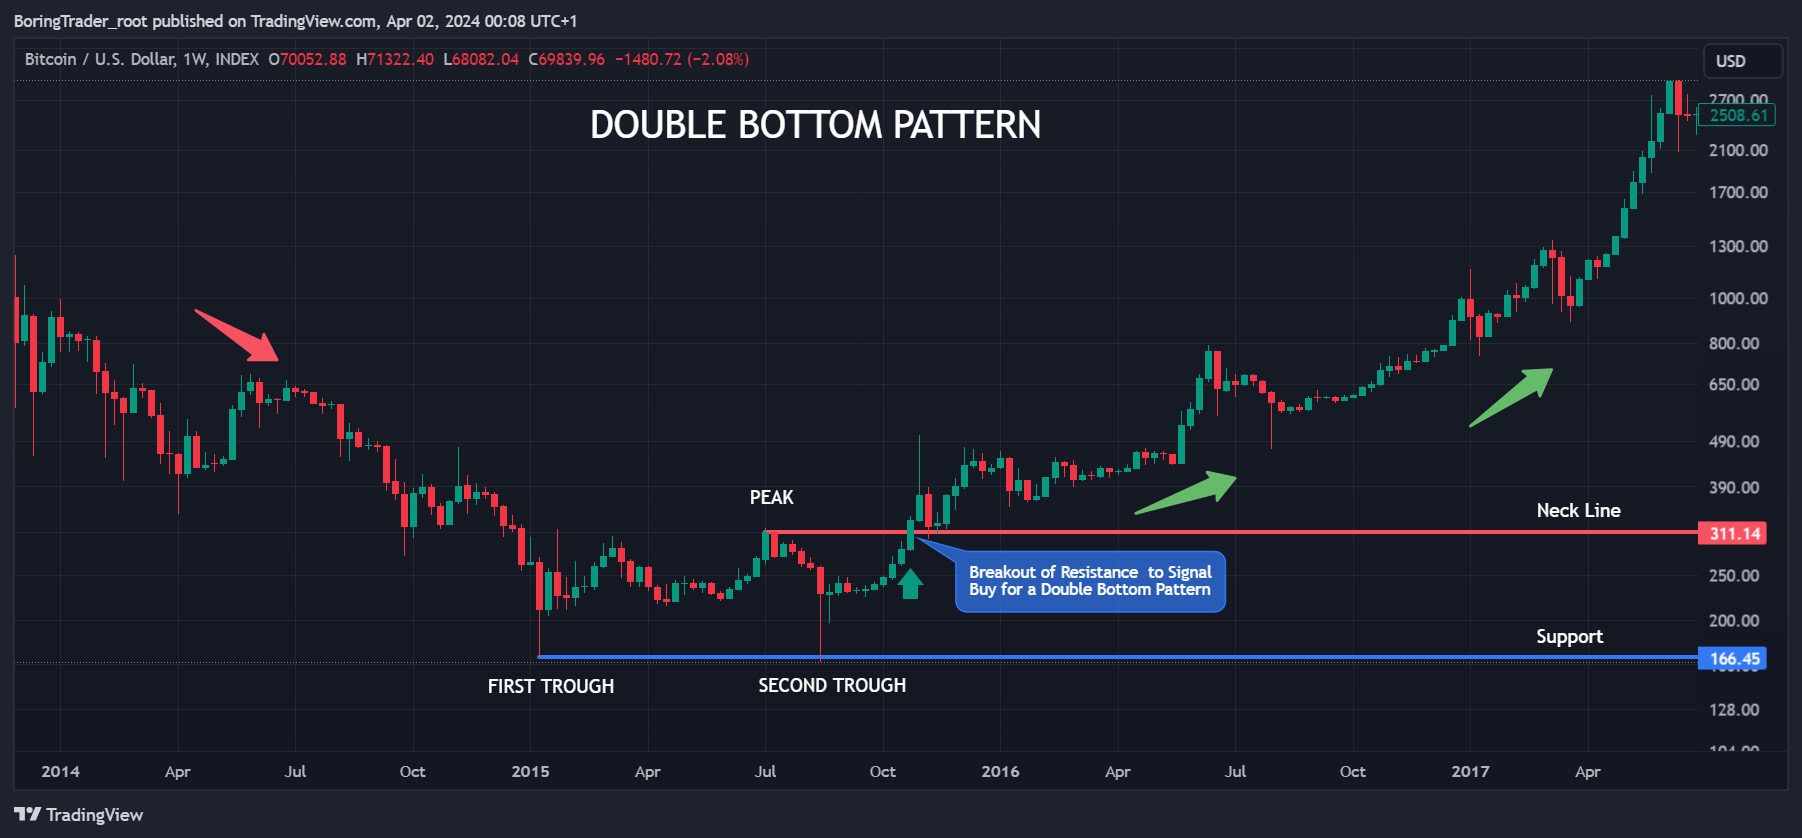
This sequence of events creates the double bottom pattern, with the $166.45 level acting as a strong support level.
Traders who identify this pattern may interpret it as a signal that the downtrend in BTCUSD cryptocurrency is coming to an end, and an uptrend may be beginning. Similar to the double top pattern, traders may use additional technical indicators, such as volume analysis or moving averages, to look for further evidence of a potential trend reversal.
In this example, traders who recognized the double bottom pattern and confirmed it with other technical indicators may have decided to take a long position in BTCUSD cryptocurrency, anticipating an uptrend.
How To Trade Double Tops and Bottoms
Trading double tops and bottoms can be a valuable strategy for traders looking to capitalize on trend reversals in financial markets. These patterns can provide clear entry and exit points, allowing traders to take advantage of potential price movements. Here’s a guide on how to trade double tops and bottoms effectively:
Identify the Pattern
The first step in trading double tops and bottoms is to identify the pattern on a price chart. Look for two peaks (double top) or two troughs (double bottom) that are roughly equal in height or depth, respectively, with a temporary reversal in between.
Confirm the Pattern
Once you have identified a potential double top or bottom pattern, confirm it with other technical indicators. Look for signs of weakness in the current trend, such as decreasing volume or momentum, to validate the pattern.
Entry Point
Enter a trade after the pattern has been confirmed and the price breaks below the neckline (for a double top) or above the neckline (for a double bottom). This breakout confirms the reversal of the trend and can be used as an entry point for a trade.
Stop-Loss and Take-Profit Levels
Set stop-loss orders below the neckline (for a double top) or above the neckline (for a double bottom) to limit potential losses. Take-profit orders can be set at a distance equal to the height of the pattern, measured from the neckline to the highest (for a double top) or lowest (for a double bottom) point of the pattern.
Risk Management
Manage your risk by only risking a small percentage of your trading capital on each trade. This will help protect your account from large losses.
Monitor the Trade
Once you have entered a trade, monitor it closely for any signs of reversal. Consider trailing your stop-loss to lock in profits as the trade moves in your favor.
By following these steps and using proper risk management techniques, traders can effectively trade double tops and bottoms and potentially profit from trend reversals in financial markets.
Pros/Cons of the Double Top and Bottom Pattern
The double top and bottom pattern is a popular chart pattern used by traders to identify potential trend reversals in financial markets. Like any trading strategy, the double top and bottom pattern has its pros and cons.
Pros
Clear Signal
The double top and bottom pattern provides a clear and easily recognizable signal of a potential trend reversal. This can help traders make informed trading decisions.
Risk Management
By identifying the pattern and placing stop-loss orders accordingly, traders can effectively manage their risk. This can help minimize losses if the pattern fails to materialize.
Profit Potential
Trading the double top and bottom pattern can offer significant profit potential. If the pattern is confirmed and the trend reversal occurs as expected, traders can profit from the subsequent price movement. However, it’s important to validate your candidate financial securities for momentum and mean reversion traits, as the pattern may yield more profit in specific market regimes compared to others.
Versatility
The double top and bottom pattern can be applied to various timeframes and markets, making it a versatile tool for traders.
Cons
False Signals
Like any technical analysis tool, the double top and bottom pattern is not foolproof and can sometimes produce false signals. Traders should use additional technical indicators to confirm the pattern before entering a trade.
Subjectivity
Identifying the double top and bottom pattern can be subjective, as different traders may interpret the pattern differently, mostly the approximation of peaks and troughs. This can lead to confusion and inconsistent trading decisions. To avert this, traders should independently come up with strict conditions to identify the pattern, backtest, and validate the patterns across different financial assets.
Whipsaws
In fast-moving markets, the double top and bottom pattern can sometimes result in whipsaws, where the price briefly breaks below or above the neckline before reversing direction. This can lead to losses for traders who are not quick to react.
Risk of Missing Out
While waiting for confirmation of the pattern, traders risk missing out on potential profits if the trend reversal occurs before the pattern is confirmed.