

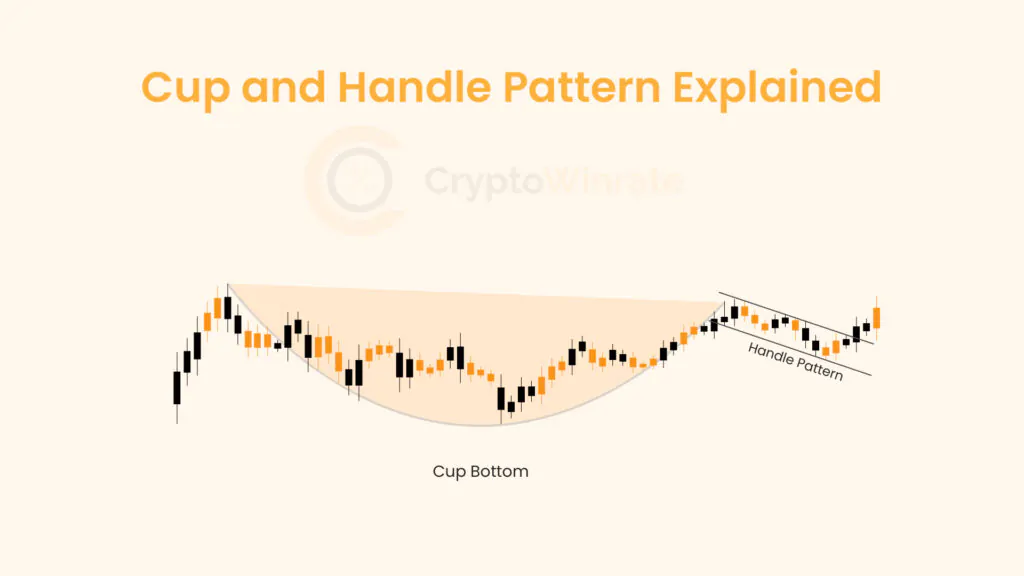
What is the Cup And Handle Pattern?
The cup and handle pattern, a popular technical chart pattern, is utilized by traders to spot potential bullish continuation patterns in financial markets. This pattern consists of two key components: the cup and the handle. Initially documented by William J. O’Neil in his 1988 seminal work on technical analysis, “How to Make Money in Stocks,” the cup and handle pattern has since become a staple in the toolkit of many traders.
The cup forms when the price of an asset initially rises to a peak, then declines to form a rounded bottom, resembling a “U” shape or a cup. The handle is formed when the price of the asset consolidates in a small range near the peak of the cup, forming a slight downward slope or a handle.
Traders typically look for the following characteristics when identifying a cup and handle pattern:
Cup Shape
The cup should have a smooth, rounded bottom with roughly equal highs on both sides. The depth of the cup should ideally be between one-third and two-thirds of the previous advance.
Handle Formation
The handle should form after the cup and should be a relatively small, downward-sloping price movement. The handle should ideally form in a range of 1 to 4 weeks.
Volume
Volume should decline as the cup develops and remain low during the formation of the handle. An increase in volume during the breakout from the handle is seen as a bullish signal.
Breakout
The pattern is considered complete when the price breaks out above the resistance level formed by the handle. Traders often look for a breakout on high volume to confirm the pattern.
The cup and handle pattern is considered a bullish continuation pattern, indicating that the uptrend is likely to continue after the pattern completes. Traders often use the height of the cup as a measure of the potential price target after the breakout.
By understanding the characteristics of the pattern and using it in conjunction with other technical indicators, traders can make more informed trading decisions and potentially profit from the continuation of an uptrend.
Cup and Handle Examples
The cup and handle pattern is a widely recognized technical analysis pattern that can provide valuable insights into potential bullish continuation patterns in financial markets. This pattern is characterized by two main components: the cup, which resembles a “U” shape, and the handle, which forms a slight downward slope near the peak of the cup. Here are a few examples to illustrate the cup and handle pattern:
Stock Example – Netflix
Consider the daily price chart of Netflix stock that has been in a strong uptrend for several days, reaching a peak of $191.50 per share. After reaching this peak, the price declines to $164.23 per share, forming the left side of the cup. The price then rebounds to $189.95 per share, forming the right side of the cup.
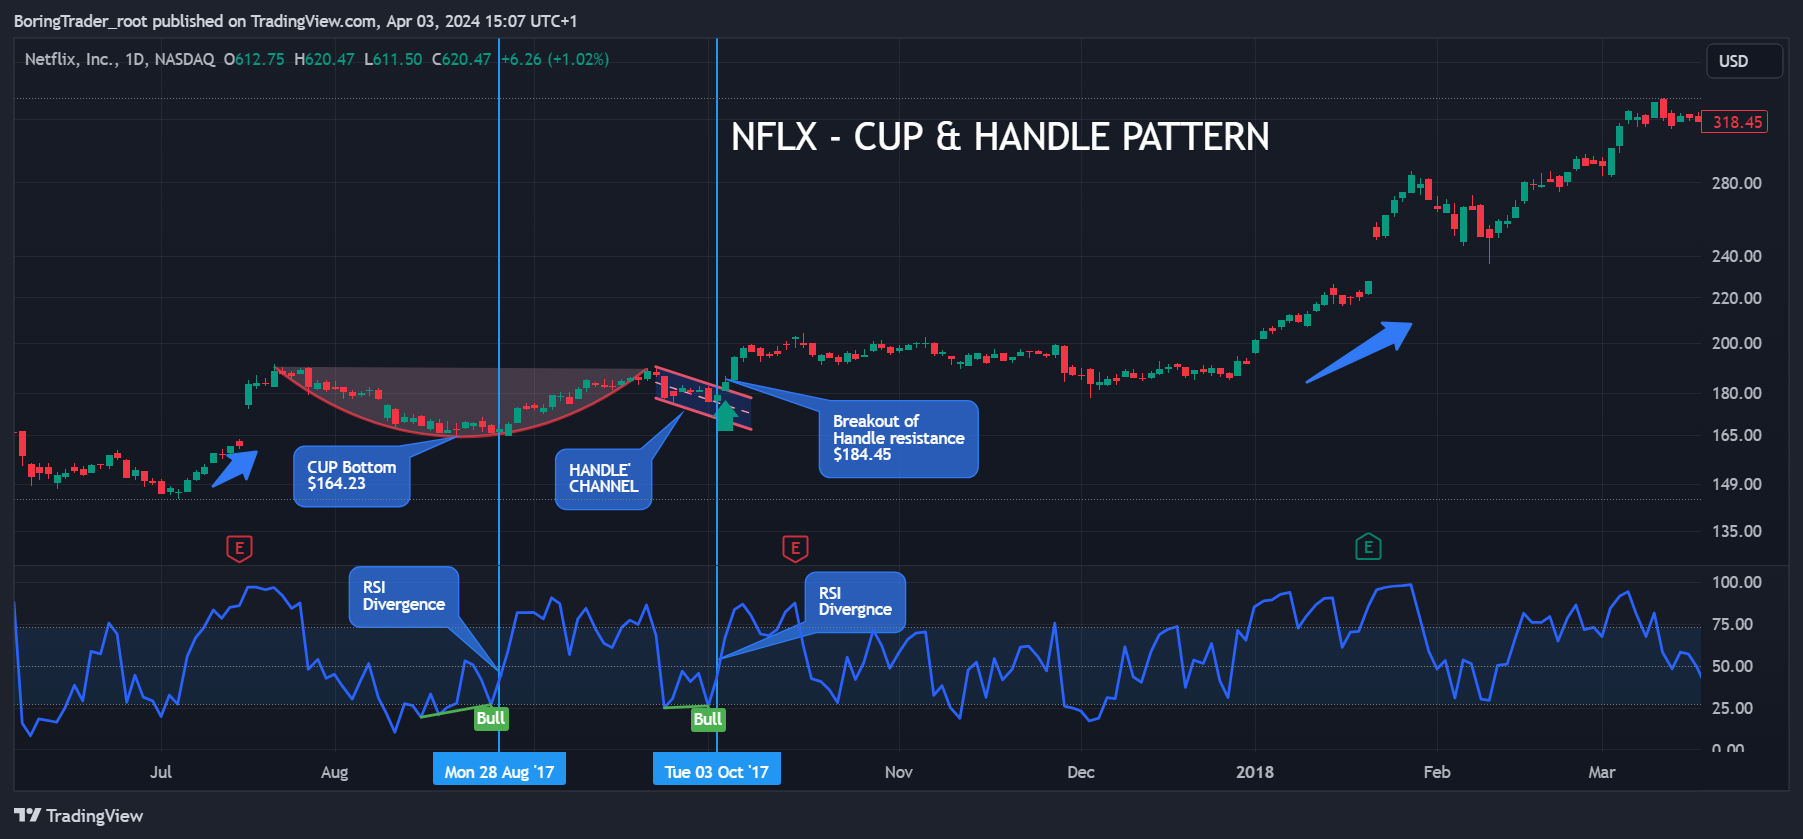
Following the formation of the cup, the price consolidated in a narrow range between $189.85 and $180.70 per share, forming the handle. The pattern is confirmed with the price breaking out above the range and closing at $184.45 per share on high volume, indicating a potential bullish continuation.
A Regular bullish divergence on Monday 28 August 2017 confirms the bottom of the cup, and a second regular bullish divergence on Tuesday 03 October 2017 confirms the breakout from the range/handle. The bullish divergence patterns form a confluence of signals that help build confidence into a long trade.
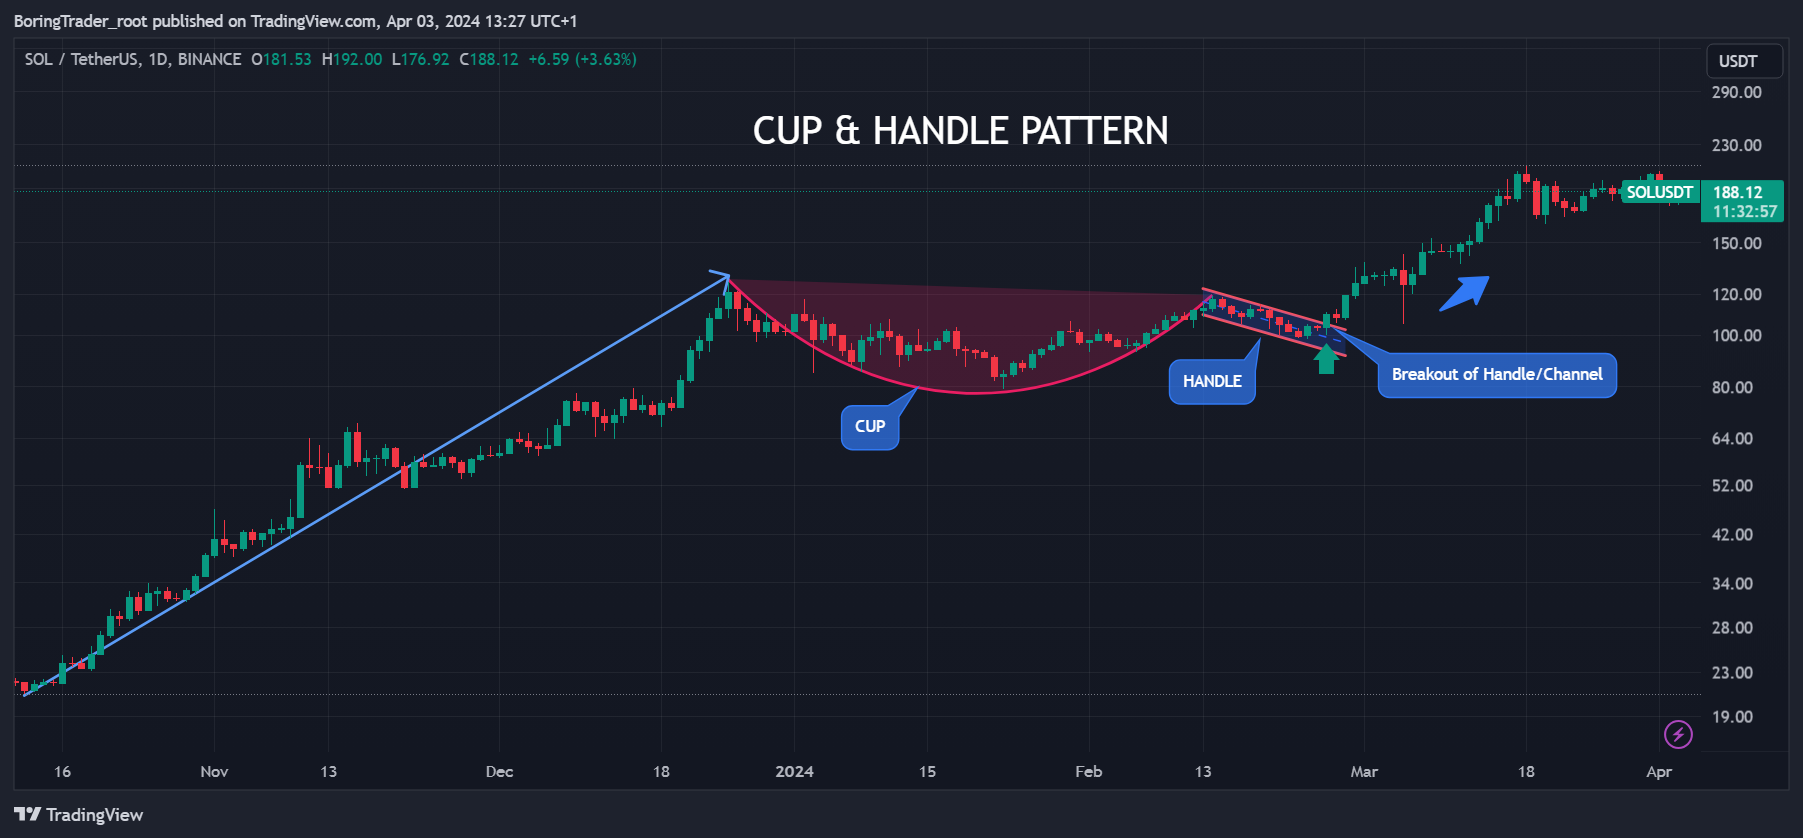
Cryptocurrency Example – SOLUSDT
The Solana vs USDT cryptocurrency pair below, forms a cup and handle pattern after a period of strong gains. The SOLUSDT rose to $126.36 forming a cup and handle pattern with a cup bottoming out at $79.00 and a handle forming between $118.69 and $98.64.
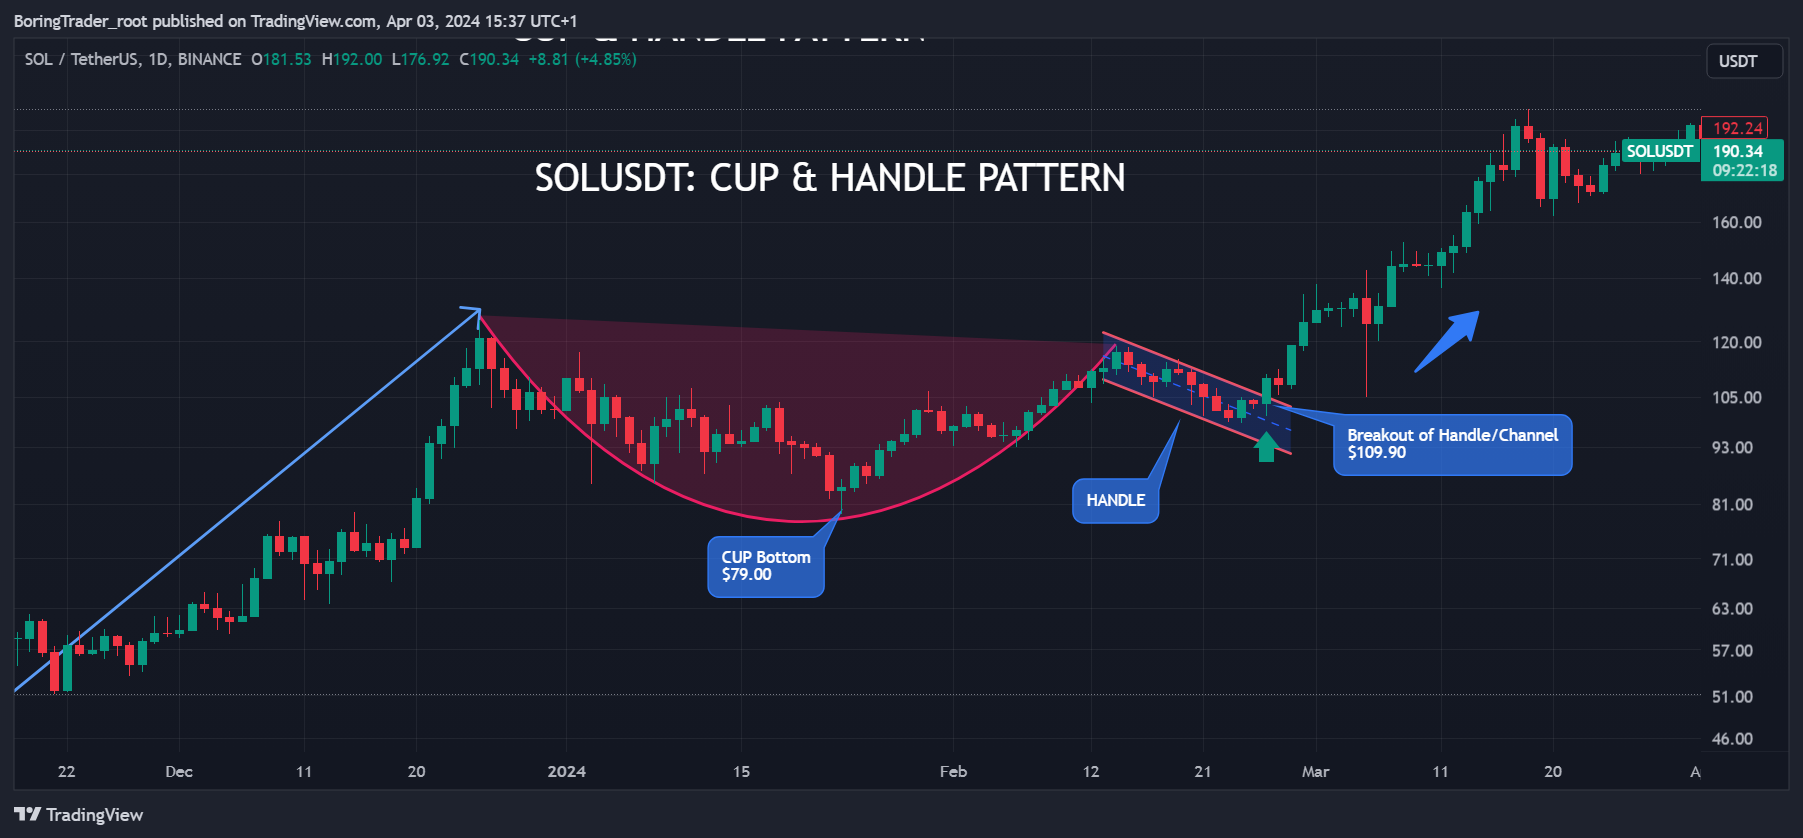
A breakout above $104.43 and closing at $109.90 on high volume confirm the pattern and signal a potential continuation of the uptrend.
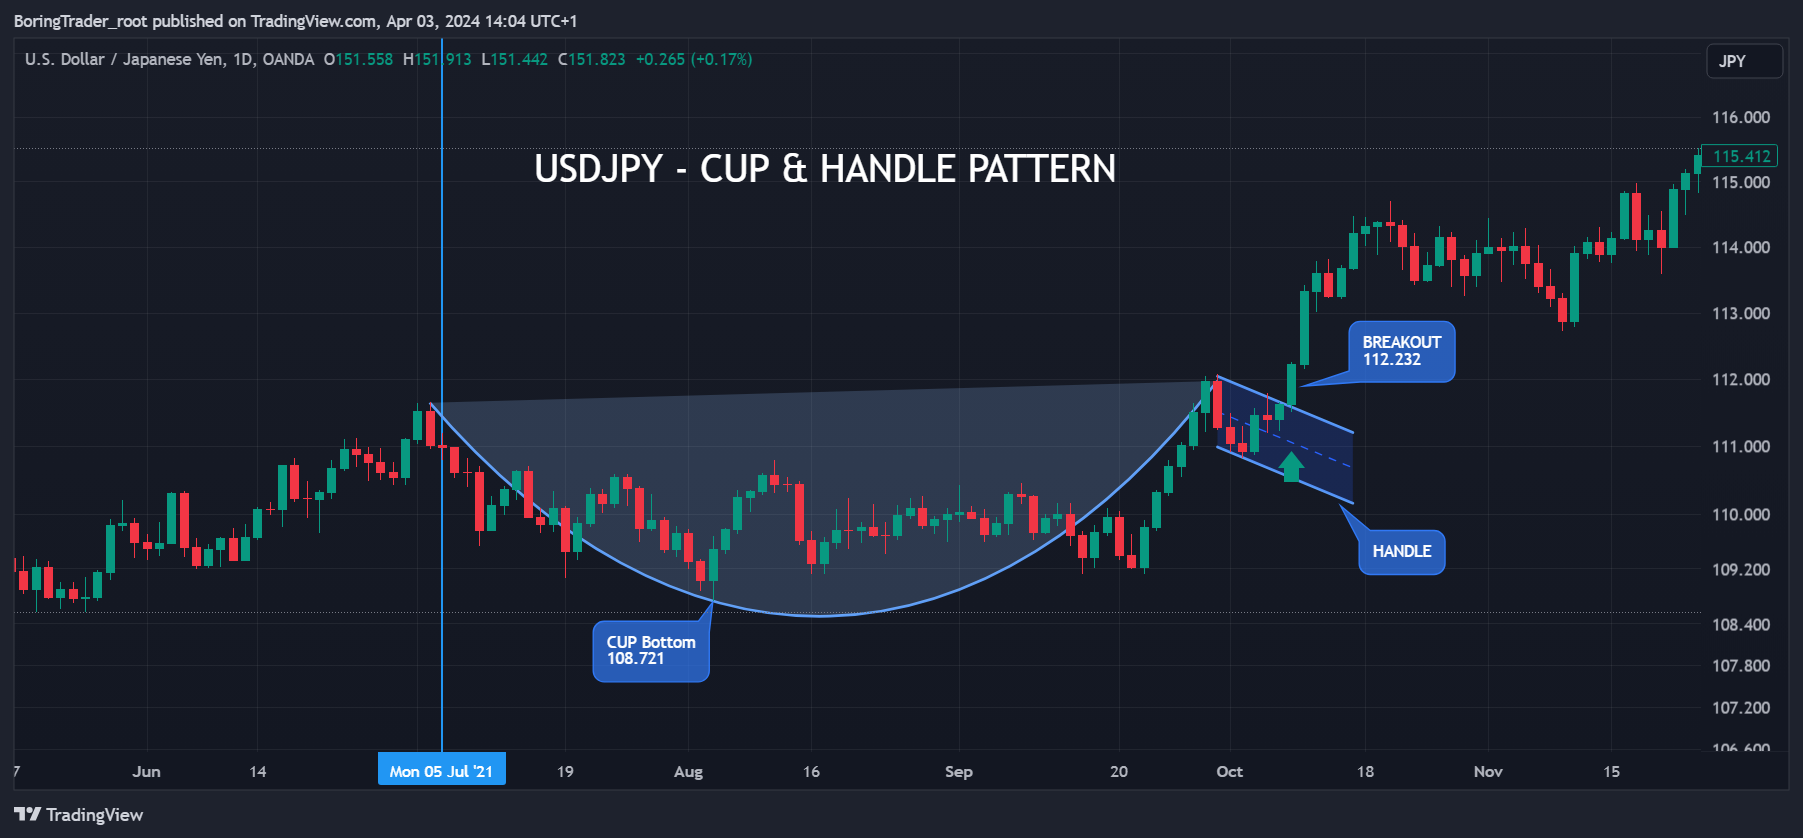
Forex Example – USDJPY
In the forex market, the USDJPY currency pair formed a cup and handle pattern after a period of consolidation. As shown below, the USD vs Japanese Yen currency pair was trading in a rising trend setting a high at $111.64, forming a cup and handle pattern with a cup bottoming out at 108.721 and a handle forming between $112.080 and $110.824. A breakout above $111.786 on high volume confirms the pattern and indicates a bullish continuation.
These examples demonstrate how the cup and handle pattern can be used by traders to identify potential bullish continuation patterns in various financial markets. Understanding the characteristics of the pattern and using it in combination with other technical indicators commonly known as a confluence of events among traders. Traders can make more informed trading decisions, with potential profits in sight from the continuation of an uptrend.
Is a Cup and Handle Bullish or Bearish?
The cup and handle pattern is generally considered a bullish continuation pattern in technical analysis. This means that the pattern is typically seen as a signal that an uptrend is likely to continue after the pattern completes. The bullish nature of the pattern is based on the underlying psychology of market participants and the pattern’s historical effectiveness in projecting future price movements.
The cup and handle pattern is bullish for several reasons:
Formation
The pattern forms after a prolonged uptrend, indicating that buyers are in control of the market. The cup formation shows a temporary pullback in prices, followed by a rounded bottom that suggests a period of consolidation and accumulation.
Handle
The handle formation, which occurs after the cup, shows a small downward movement in prices before the price breaks out above the resistance level formed by the handle. This consolidation period is seen as a bull flag, which is a bullish sign, indicating that buyers are regaining control and preparing for another push higher.
Volume
Volume tends to decrease during the formation of the cup and handle pattern and then increase during the breakout from the handle. This increase in volume during the breakout is seen as a confirmation of the pattern and a signal of increased buying pressure.
Price Target
Traders often use the height of the cup as a measure of the potential price target after the breakout. This means that if the cup is 20 points deep, traders would expect the price to rise by 20 points from the breakout level.
Overall, the cup and handle pattern is considered a bullish continuation pattern because it suggests that after a period of consolidation and accumulation (Cup & Handle), buyers re likely to regain control and push prices higher.
Cup & Handle vs Inverse Cup & Handle Pattern
The cup and handle pattern and the inverse cup and handle pattern are two common technical analysis patterns used by traders to identify potential trend reversals in financial markets. Both patterns mirror each other with structures, yet they have similar implications for price direction.
The cup and handle pattern is a bullish continuation pattern, indicating that an uptrend is likely to continue after the pattern completes. This pattern is characterized by a “U” shaped cup followed by a slight downward sloping handle. Traders typically look for this pattern after a prolonged uptrend, as it suggests that buyers are regaining control and preparing for another price push higher.
On the other hand, the inverse cup and handle pattern is a reversal pattern, indicating that a downtrend is likely to reverse into an uptrend.
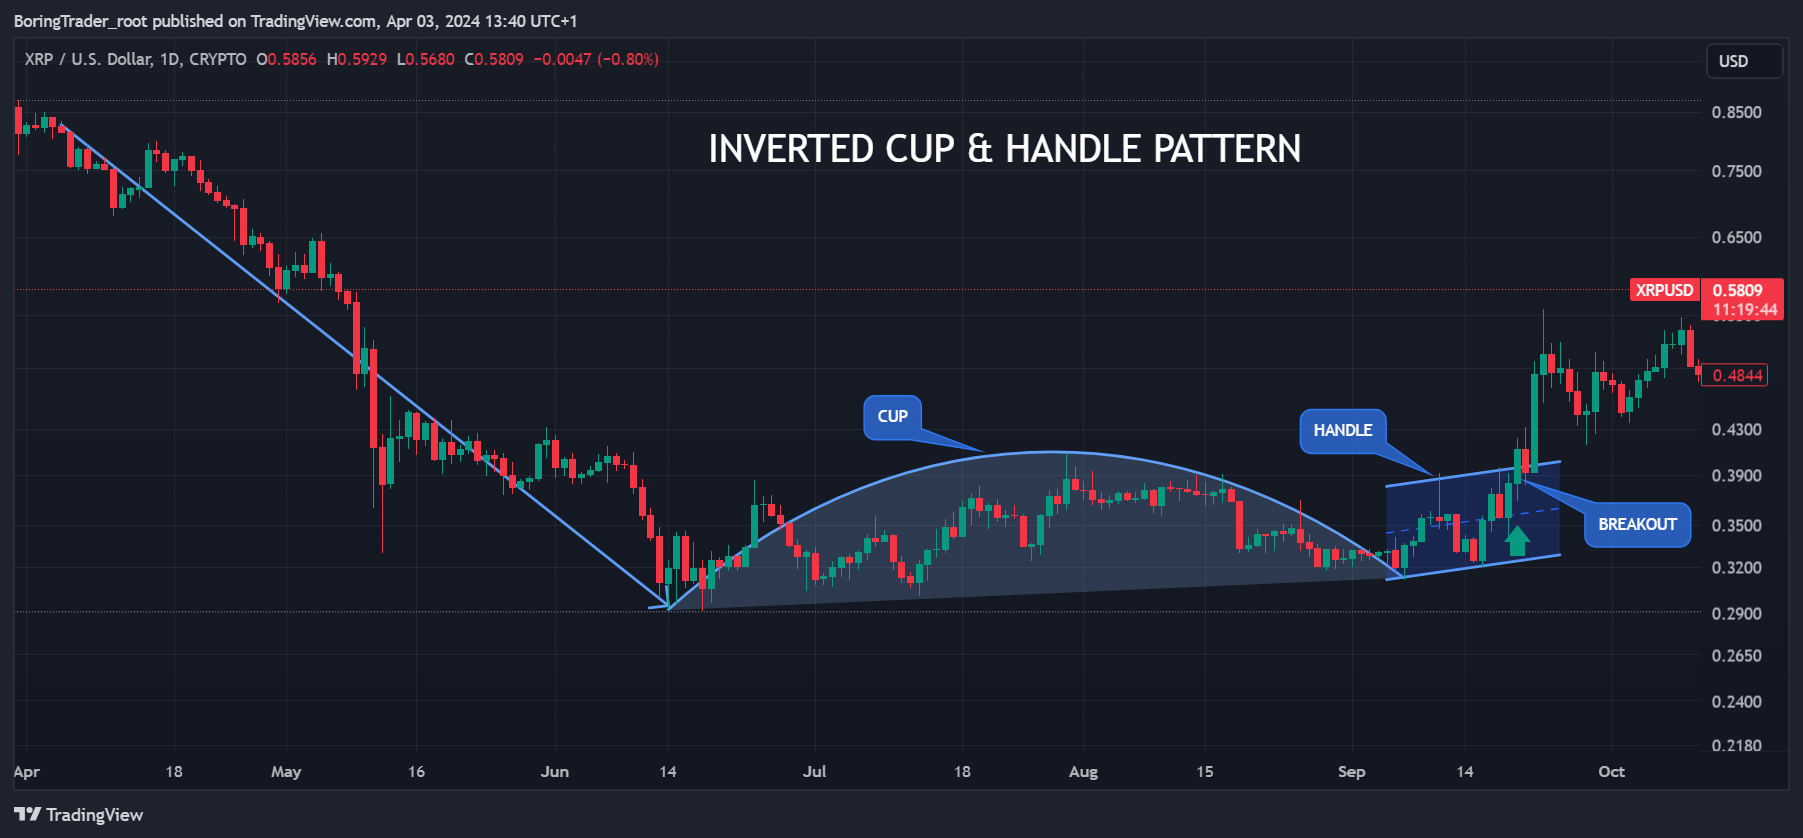
This pattern is characterized by an upside-down “U” shaped cup followed by a slight upward sloping handle. Traders typically look for this pattern after a prolonged downtrend, as it suggests that sellers are losing momentum and that buyers may be stepping in to drive prices higher.
In terms of trading strategies, traders may look to enter long positions when they identify a cup and handle pattern, anticipating a continuation of the uptrend. Conversely, traders may look to enter short positions when they identify an inverse cup and handle pattern, anticipating a reversal of the downtrend.
False signals can occur, so it is essential to validate the patterns with other tools to increase the probability of a successful trade.
How To Trade the Cup and Handle Pattern
Trading the cup and handle pattern can be a profitable strategy for traders looking to capitalize on potential bullish continuation patterns in financial markets. Here’s a guide on how to trade the cup and handle pattern effectively:
Identify the Pattern
The first step in trading the cup and handle pattern is to identify the pattern on a price chart. Look for a “U” shaped cup followed by a slight downward sloping handle. The cup should be preceded by a strong uptrend, indicating that buyers are in control.
Confirm the Pattern
Once you have identified a potential cup and handle pattern, confirm it with other technical indicators such as bullish RSI divergence. Look for signs of strength in the current trend, such as increasing volume as the cup forms and decreasing volume during the handle formation.
Entry Point
Enter a trade after the pattern is confirmed and the price breaks out above the resistance level formed by the handle. This breakout confirms the bullish continuation of the uptrend and can be used as an entry point for a long trade.
Stop-Loss and Take-Profit Levels
Set stop-loss orders below the neckline of the cup (for a long trade) to limit potential losses. Take-profit orders can be set at a distance equal to the height of the cup, measured from the neckline to the bottom of the cup.
Risk Management
Manage your risk by only risking a small percentage of your trading capital on each trade. This will help protect your account from large losses.
Pros and Cons of the Cup and Handle Pattern
The cup and handle pattern is a popular technical analysis pattern used by traders to identify potential bullish continuation patterns in financial markets. Like any trading strategy, the cup and handle pattern has its pros and cons.
Pros
Strong Signal
The cup and handle pattern is considered a strong signal of a potential trend continuation. The formation of the cup and handle indicates a period of consolidation and accumulation before a breakout, suggesting that buyers are regaining control.
Clear Entry and Exit Points
The pattern provides clear entry and exit points for traders. Traders can enter a trade after the pattern is confirmed and the price breaks out above the resistance level formed by the handle. This breakout confirms the bullish continuation of the uptrend.
Risk-Reward Ratio
Trading the cup and handle pattern often offers a favorable risk-reward ratio. By placing stop-loss orders below the pattern’s lows, traders can limit their potential losses while aiming for a price target based on the pattern’s height, potentially leading to significant profits.
Confirmation Signals
The cup and handle pattern is often accompanied by confirmation signals, such as increasing volume during the cup formation and decreasing volume during the handle formation. These signals can provide additional confidence in the pattern’s validity.
Cons
Subjectivity in Interpretation
Despite its clear visual appearance, the interpretation of the cup and handle pattern can sometimes be subjective. Traders may interpret the pattern differently, leading to inconsistencies in trading decisions.
Market Conditions
The effectiveness of the cup and handle pattern can be influenced by market conditions. In choppy or unpredictable markets, the pattern may be less reliable, increasing the risk of false signals.
Timeframe Sensitivity
The reliability of the cup and handle pattern may vary depending on the timeframe used. Traders may need to adjust their analysis based on the timeframe to ensure the pattern’s accuracy.
Over Reliance on Patterns
Relying solely on the cup and handle pattern for trading decisions can be risky. Traders should use the pattern as part of a comprehensive trading strategy that includes other technical indicators and risk management techniques.
By understanding the pros and cons of the pattern, traders can make more informed trading decisions and improve their overall trading success.
FAQ
What is the cup and handle pattern?
The cup and handle pattern is a bullish continuation pattern in technical analysis. It is characterized by a “U” shaped cup followed by a slight downward sloping handle.
What does the cup and handle pattern indicate?
The cup and handle pattern indicates a potential bullish continuation of the uptrend. It suggests that after a period of consolidation and accumulation, buyers are regaining control and preparing for another push higher.
Can the cup and handle pattern be applied to different timeframes and markets?
Yes, the cup and handle pattern can be applied to various timeframes and markets. Traders often look for this pattern in stocks, cryptocurrencies, and forex markets to identify potential bullish continuation patterns.
How long does it typically take for a cup and handle pattern to form?
The time it takes for a cup and handle pattern to form can vary, but it often ranges from several weeks to several months. Traders should look for the pattern to develop over a period of time to ensure its validity.
Can the cup and handle pattern fail to indicate a bullish continuation?
Yes, while the cup and handle pattern is considered a strong signal of a potential bullish continuation, it is not foolproof. There is always a risk of false signals, so it is important for traders to use other technical analysis tools to confirm the pattern.
What are some common mistakes traders make when trading the cup and handle pattern?
One common mistake is entering a trade too early, before the pattern is fully formed and confirmed. Another mistake is failing to use stop-loss orders to limit potential losses if the trade goes against them.
Are there any variations of the cup and handle pattern?
Yes, there are variations of the cup and handle pattern, such as the “deep cup and handle” pattern, which has a deeper and more pronounced cup formation. Traders should be aware of these variations and how they can impact the interpretation of the pattern.
How can traders distinguish between a cup and handle pattern and a rounding bottom pattern?
While both patterns have similar “U” shaped formations, the key difference is the presence of a handle in the cup and handle pattern. The handle is a slight downward sloping price movement near the peak of the cup, which is not present in a rounding bottom pattern.